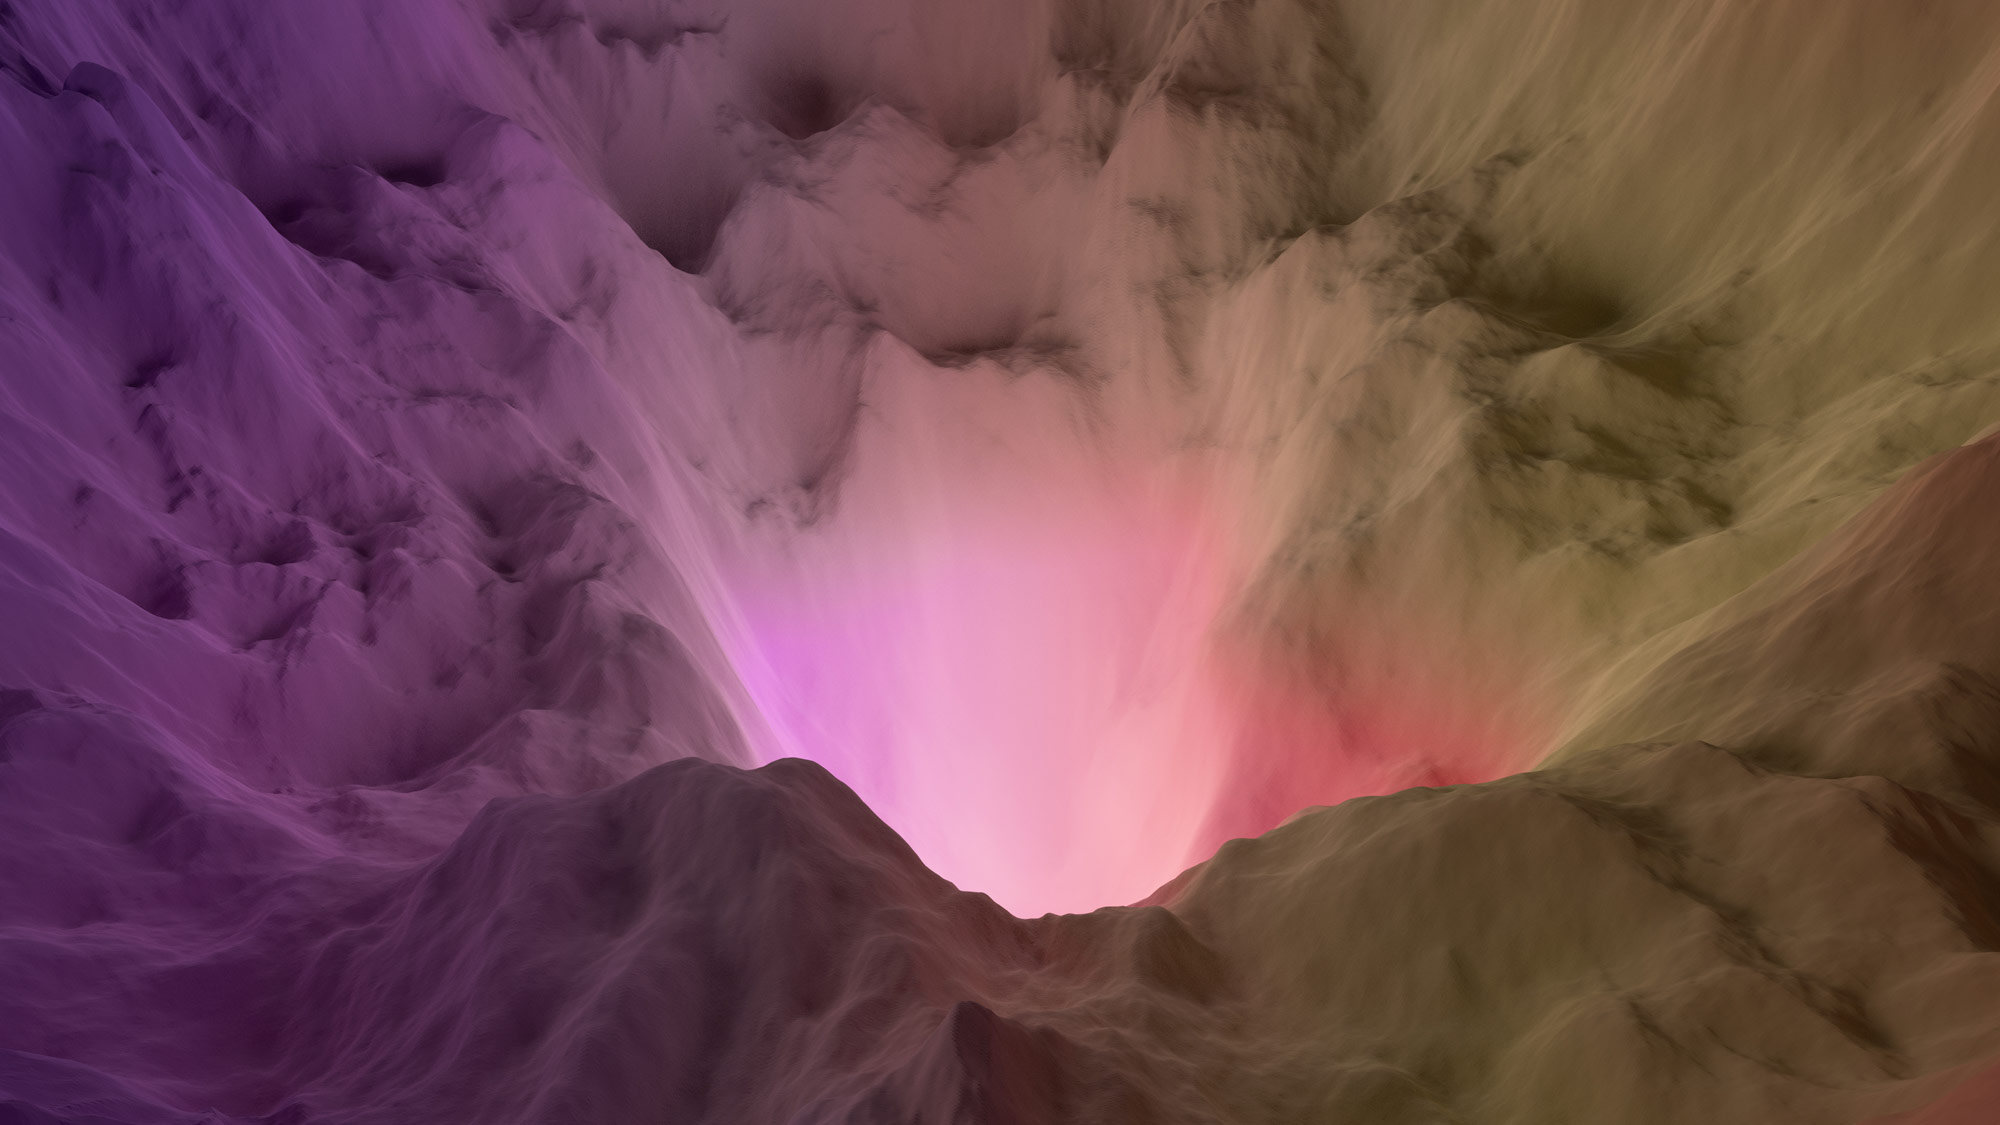
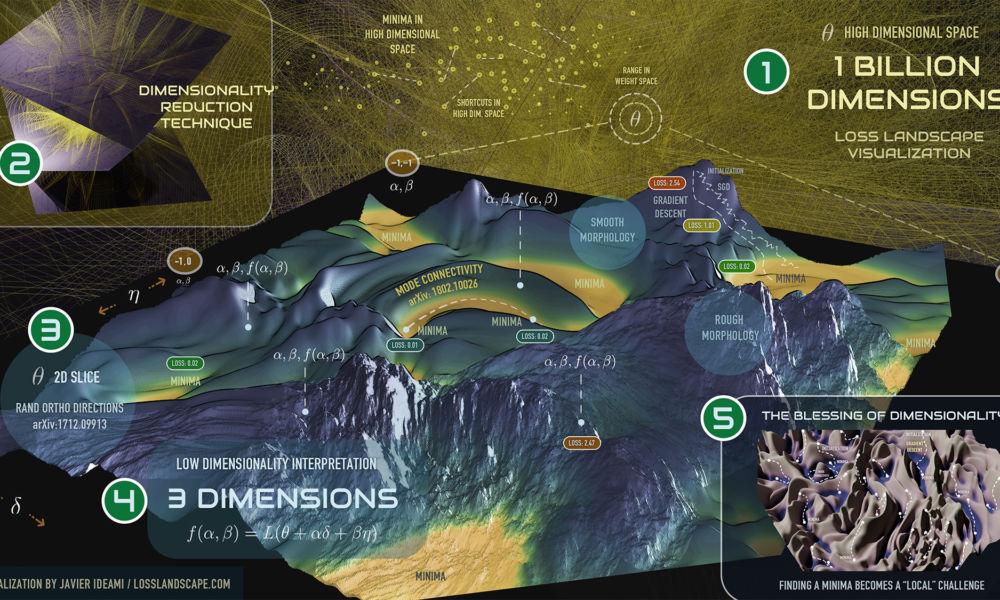
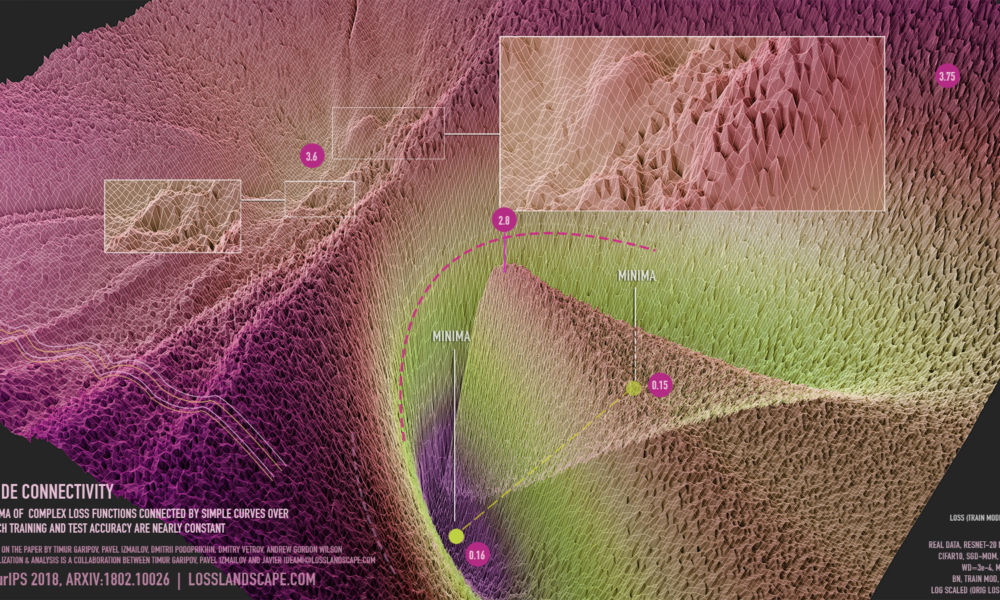
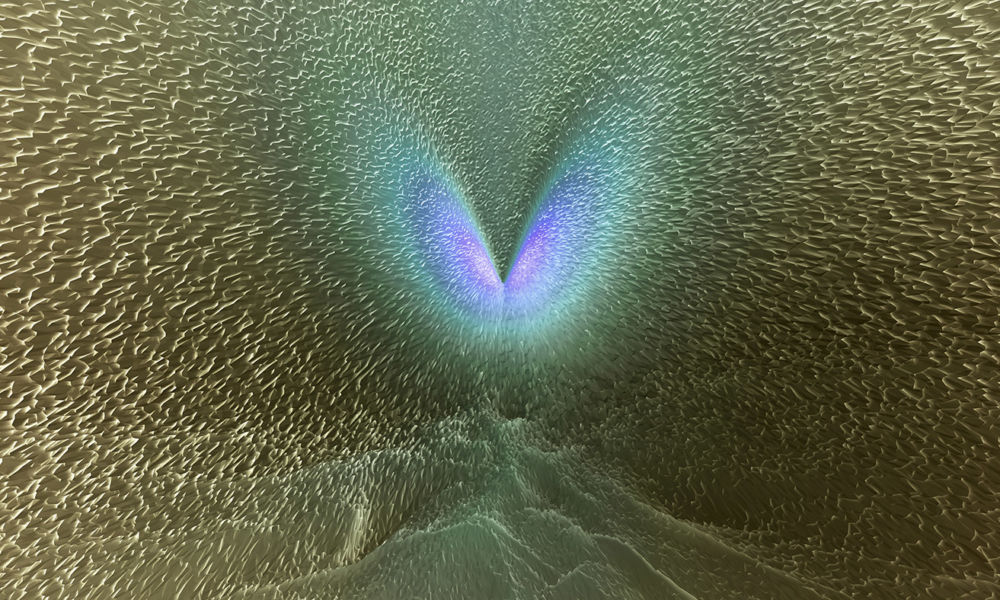
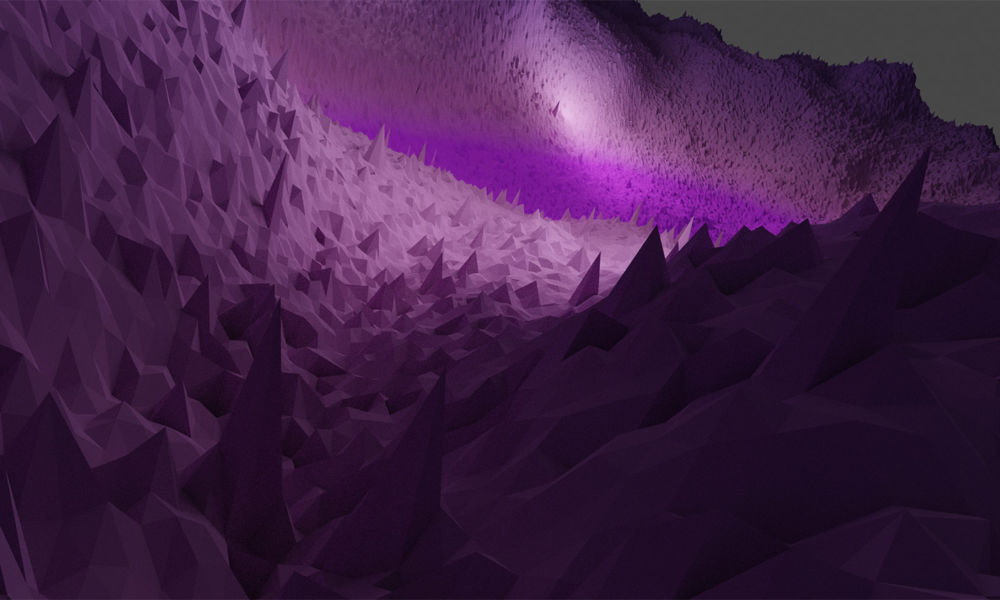
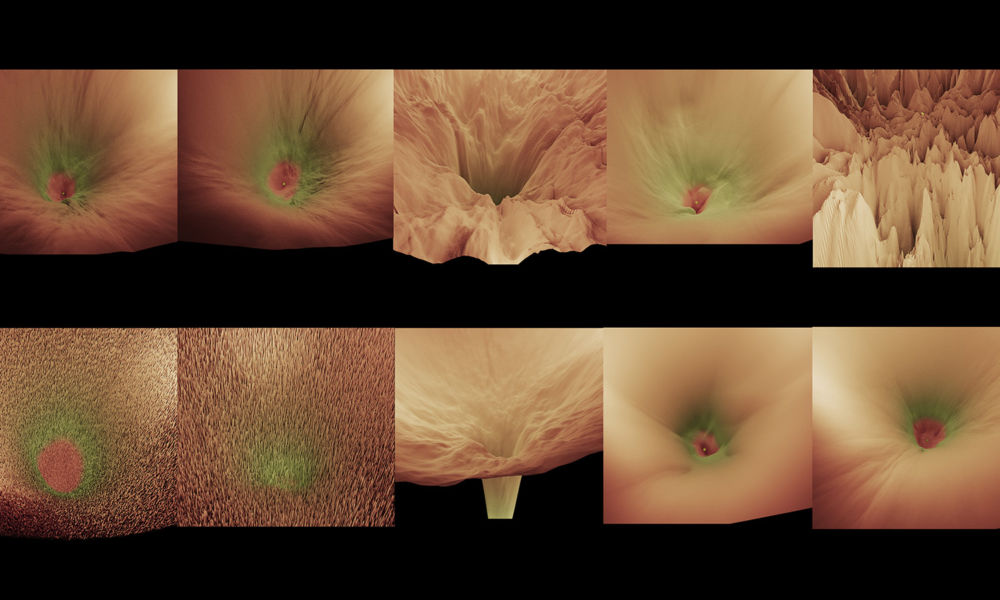
Every LL piece has been created through a multi day process composed of different stages that begin with the training of deep learning neural networks and proceeds through a number of phases until arriving to the final artwork. Click on the artworks to open them fully. These are just a few of the available pieces created by the project.
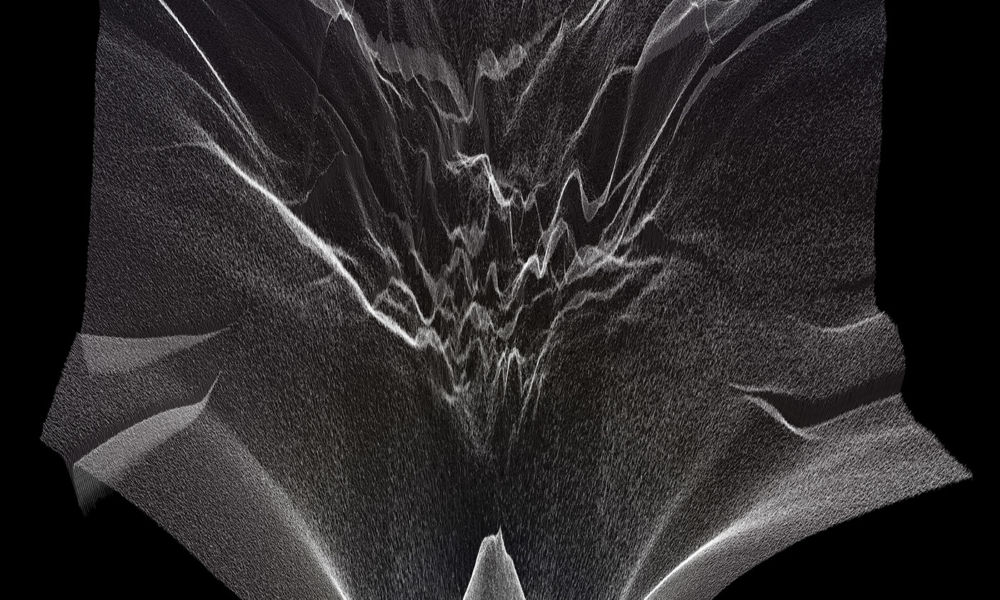
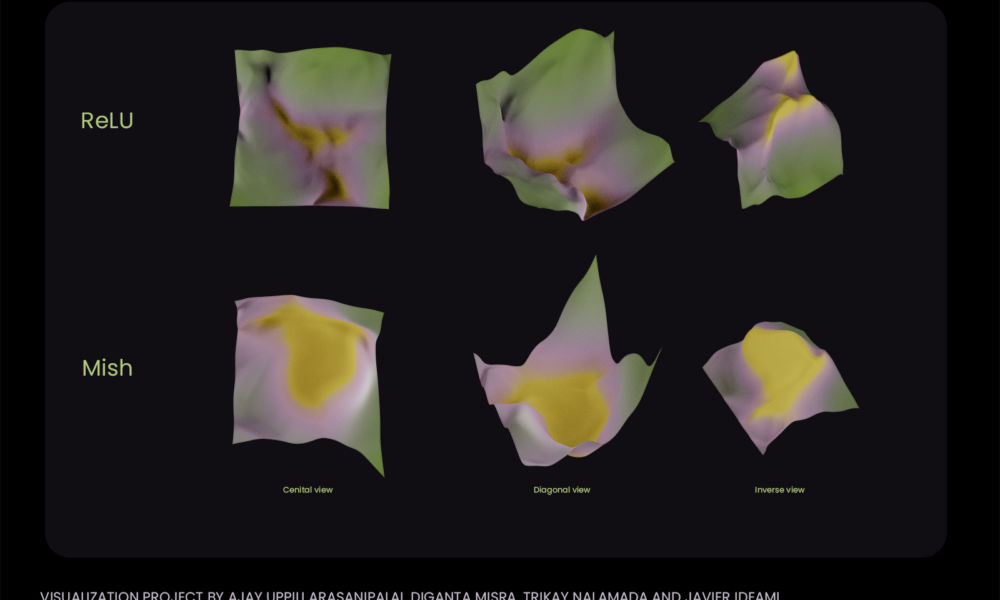
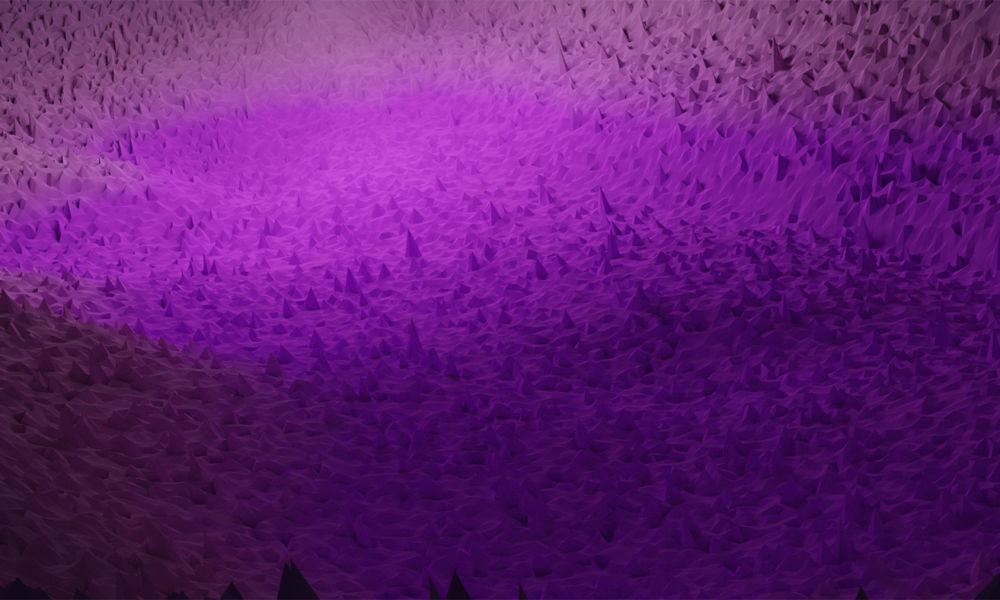
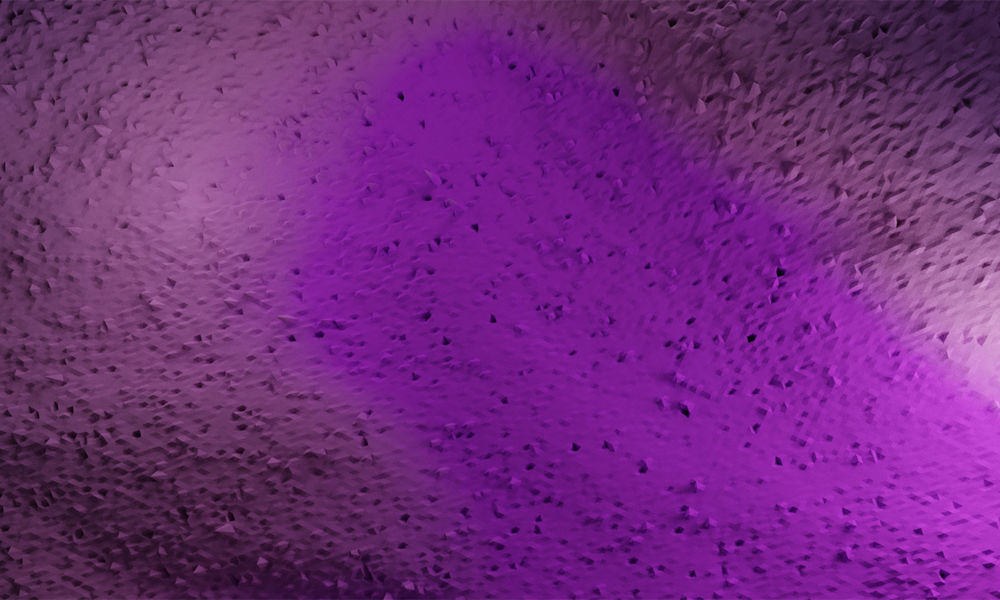
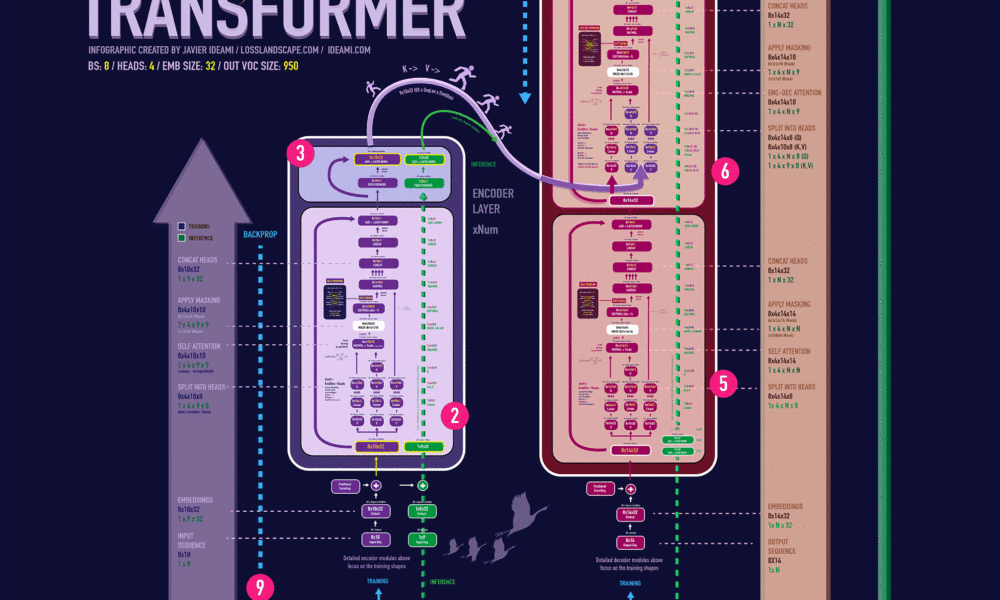
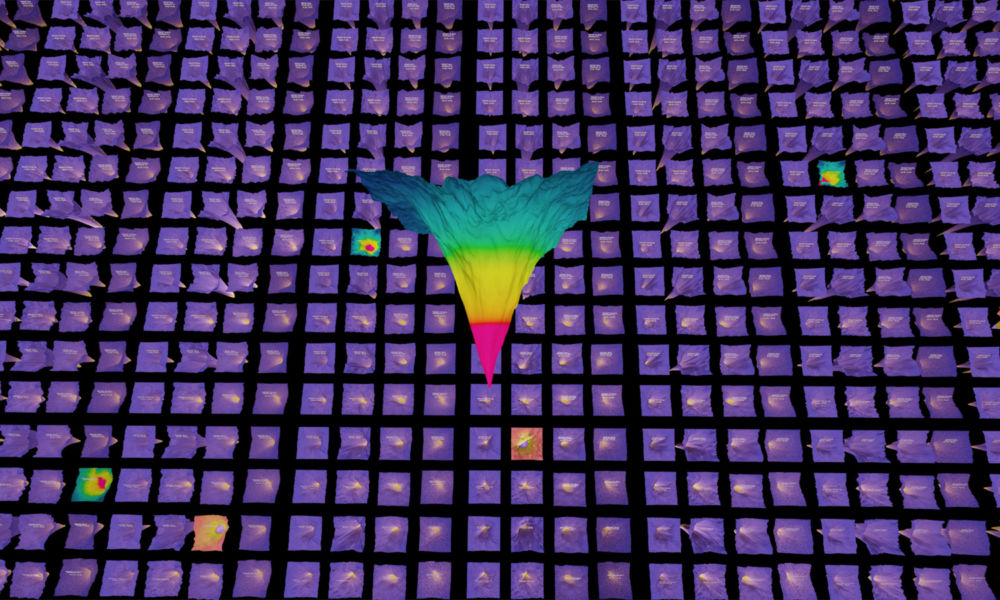
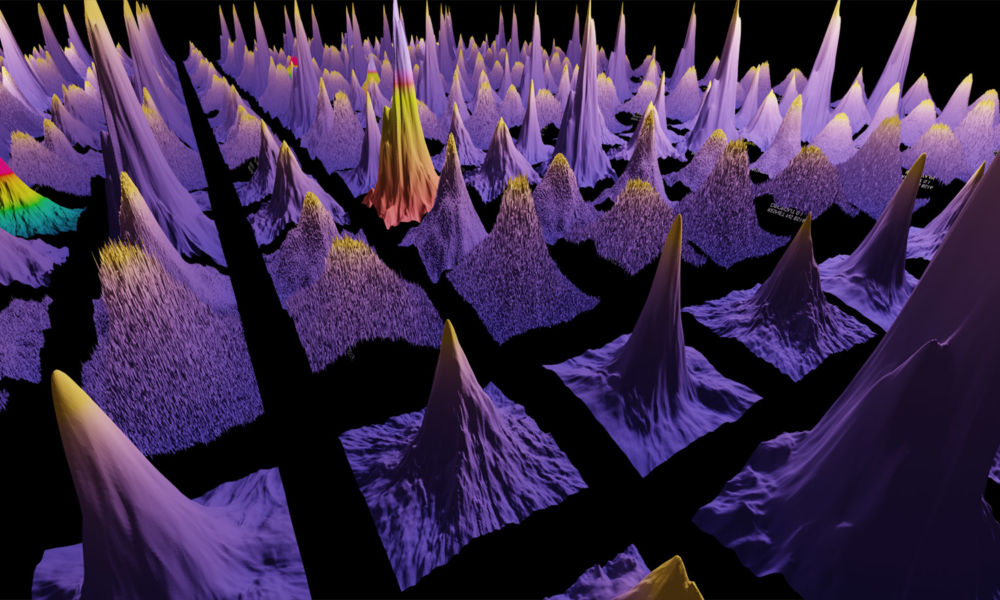
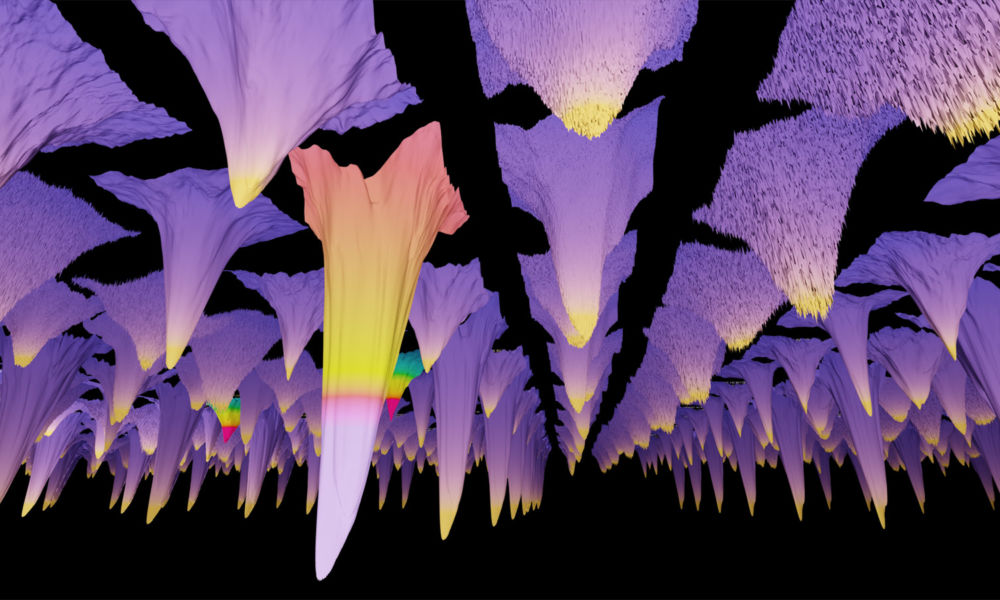
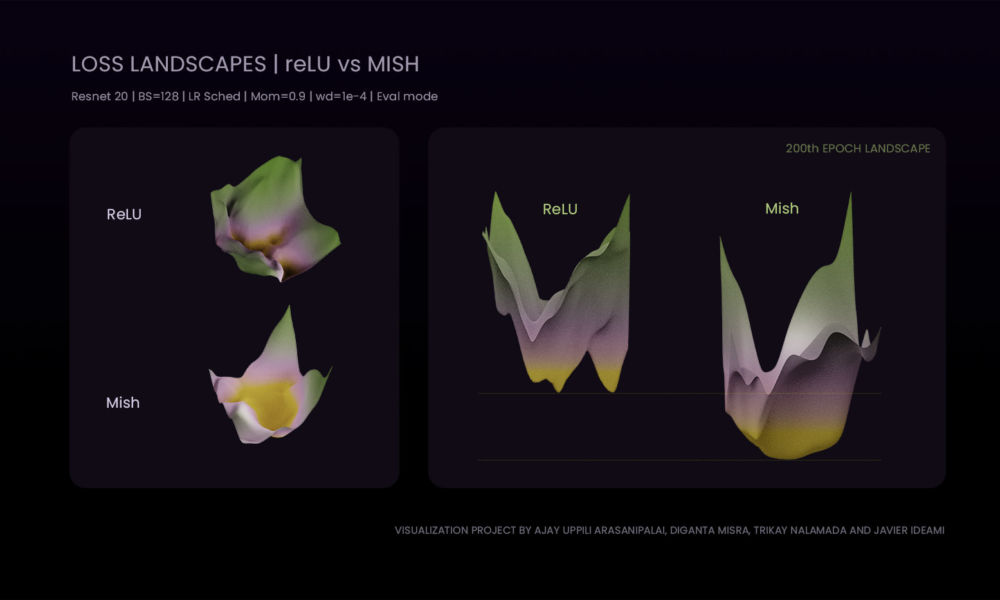
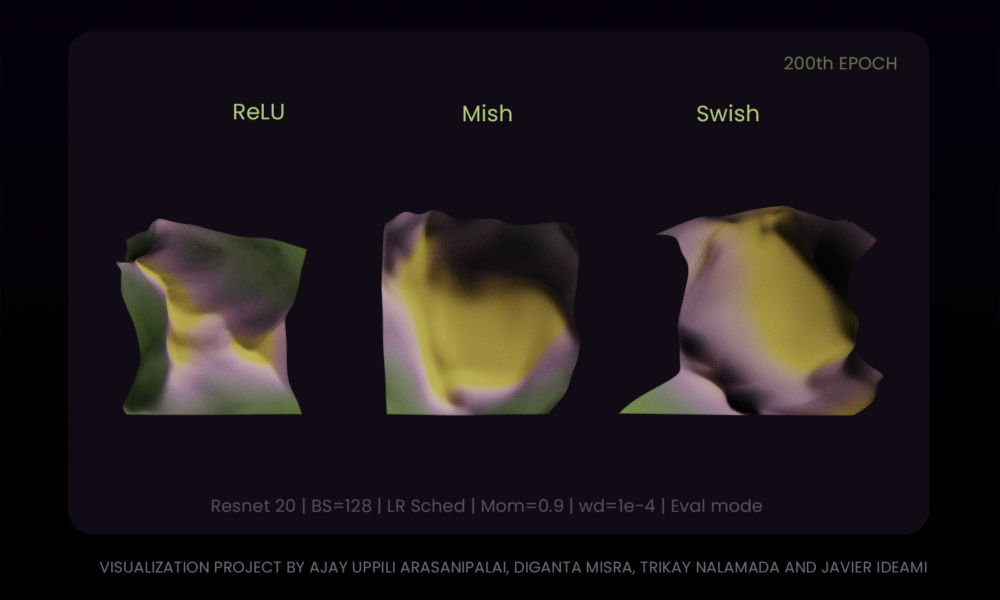
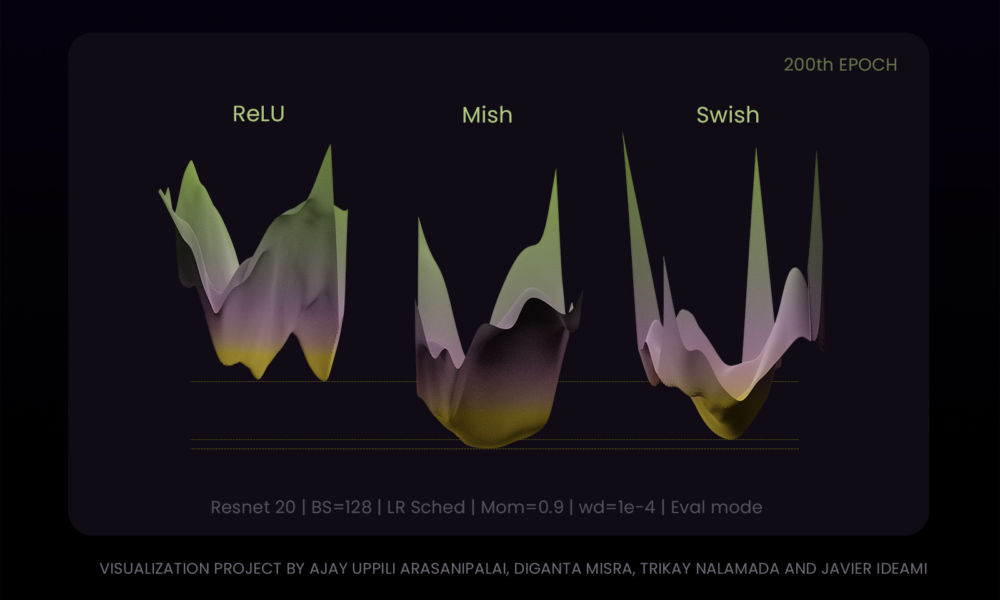
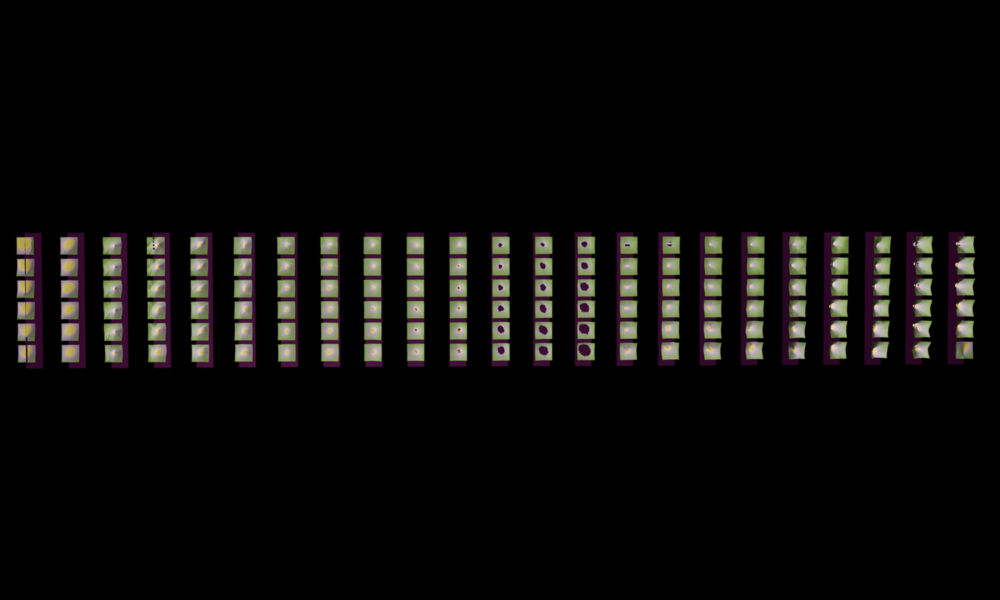
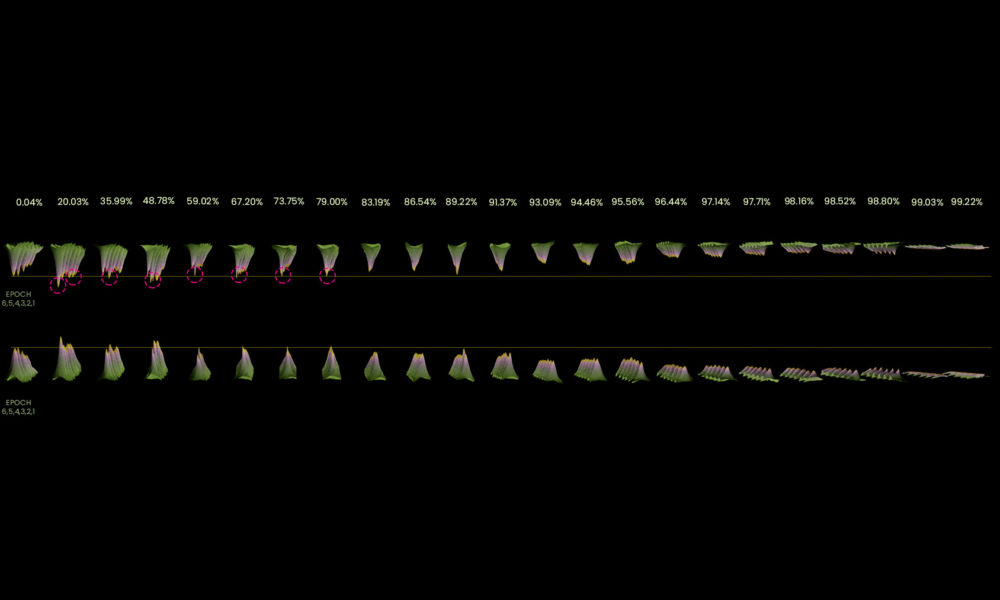
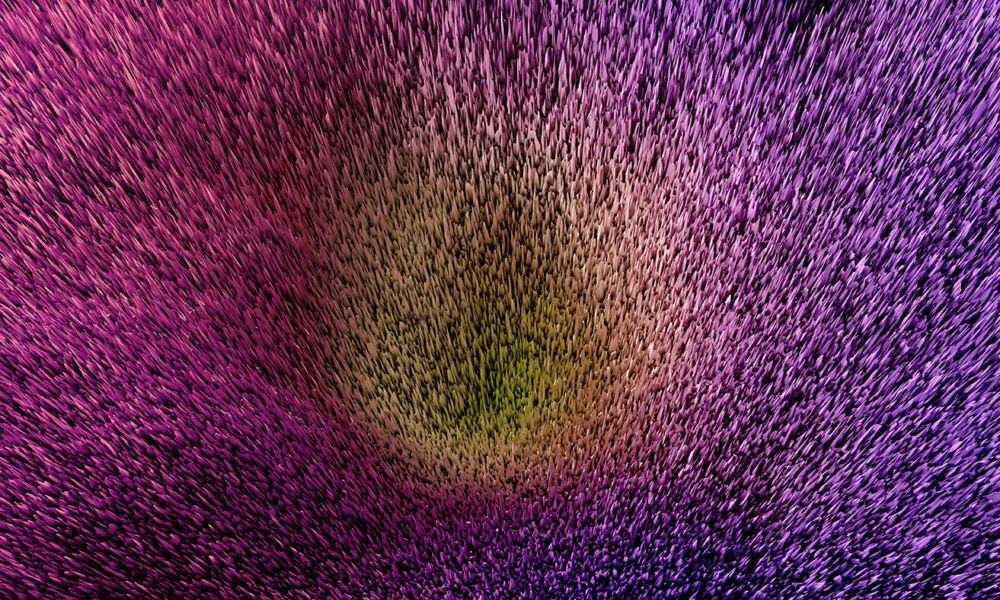
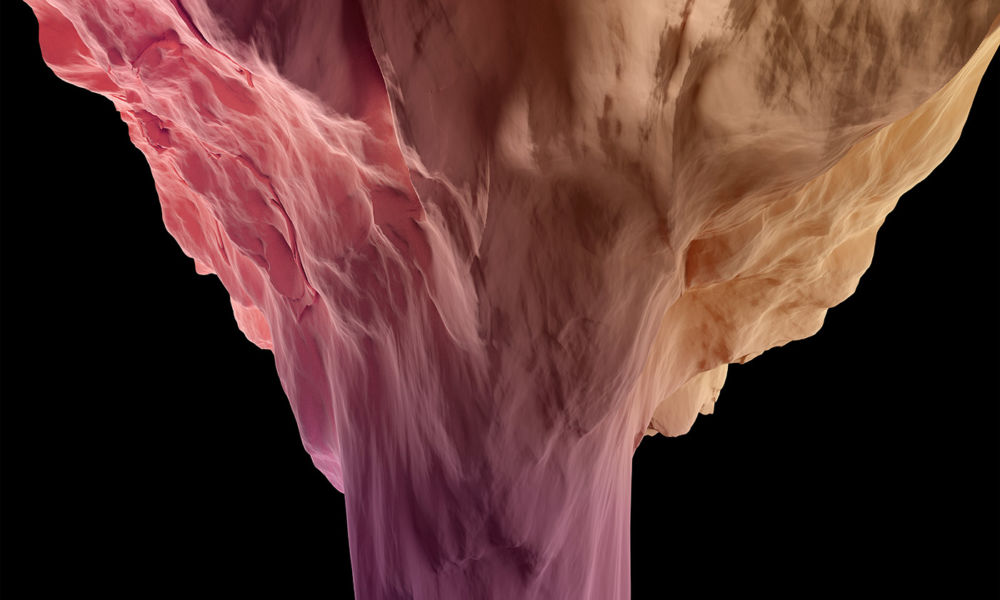
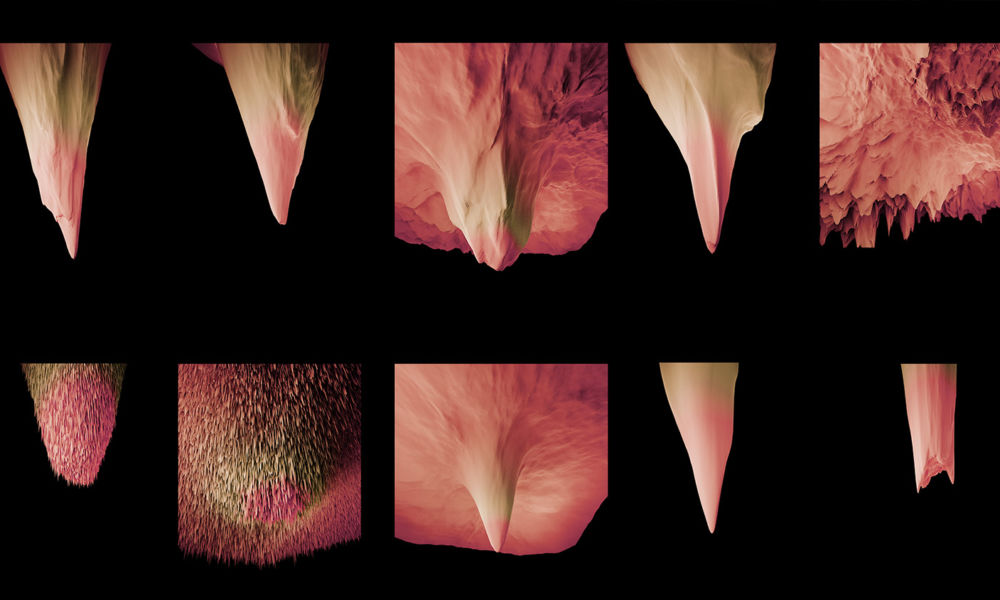
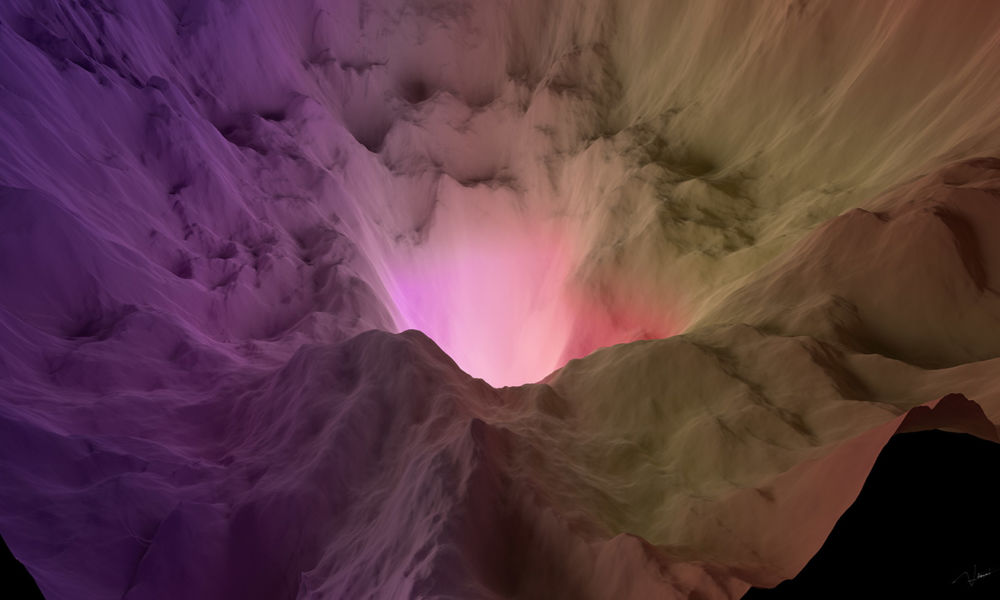
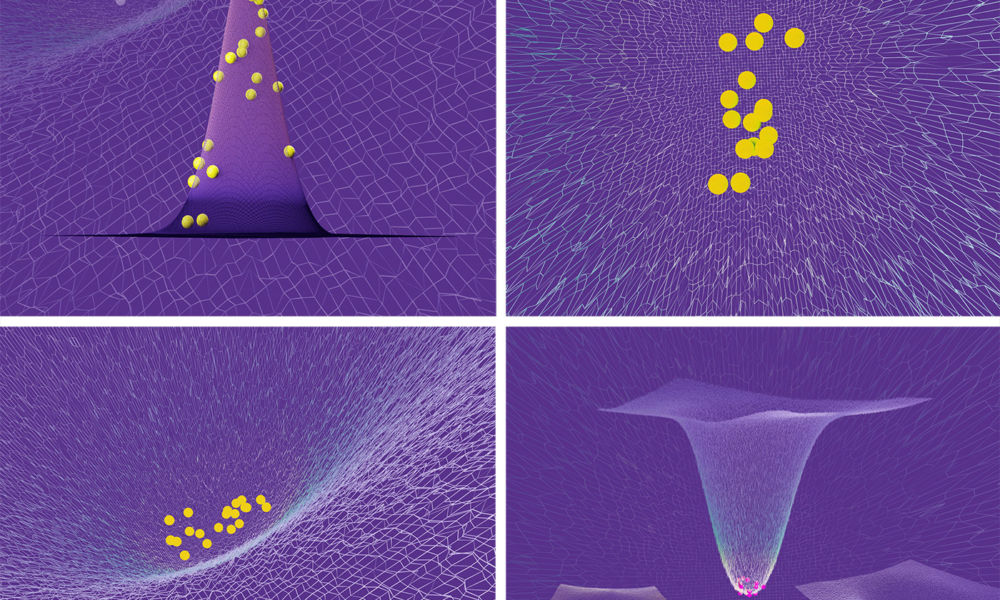
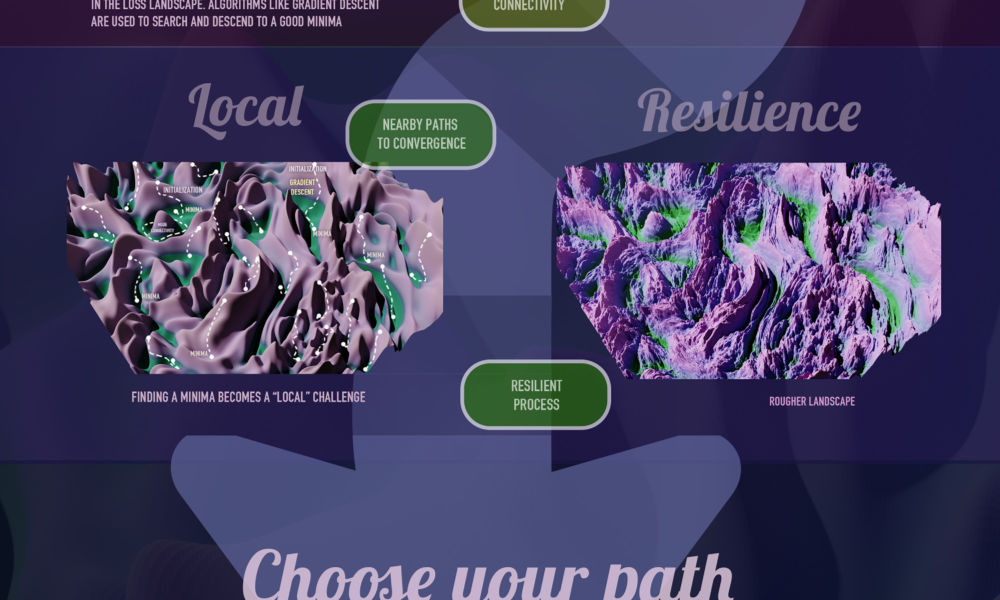
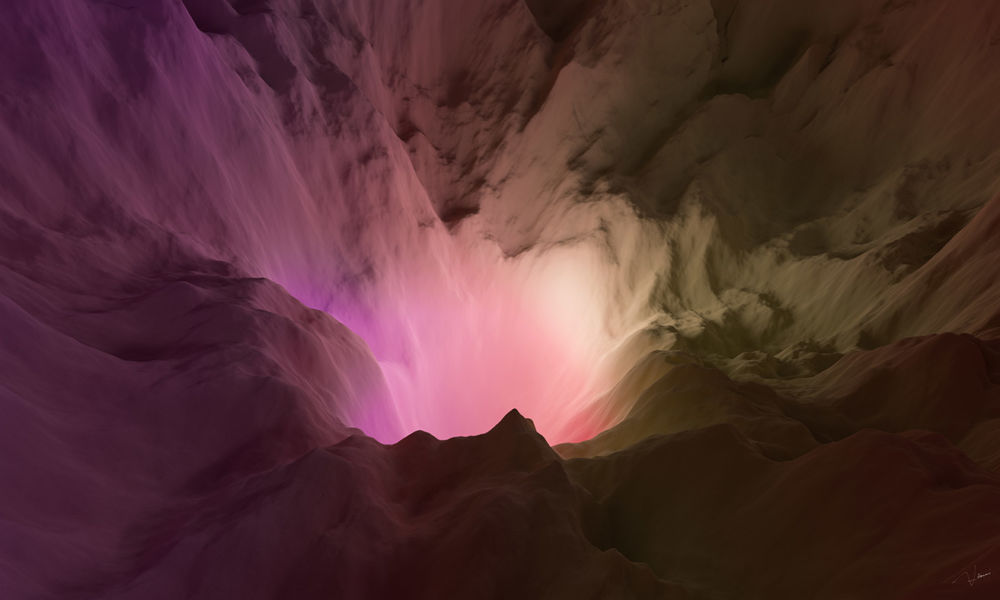
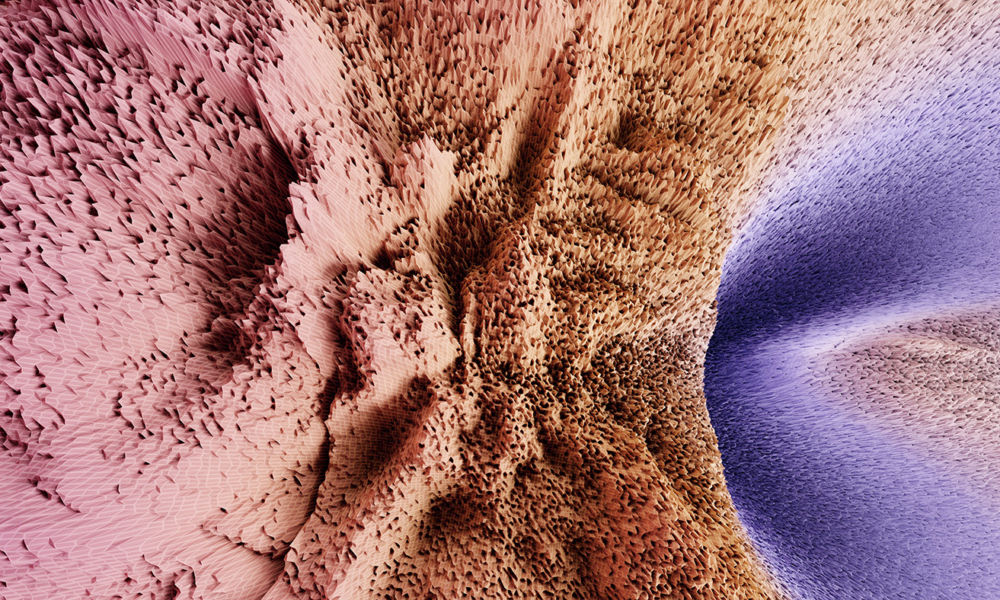
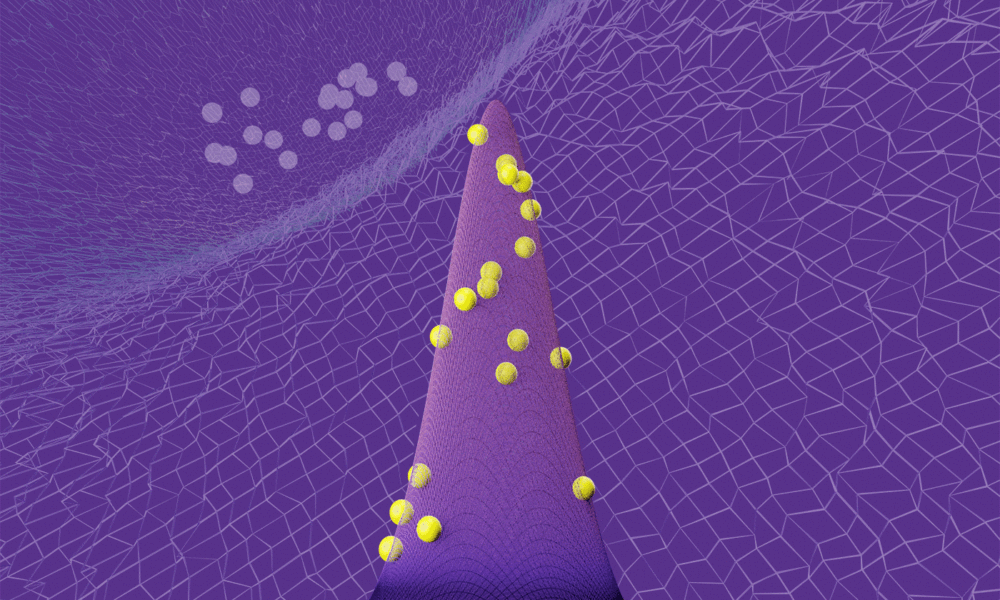
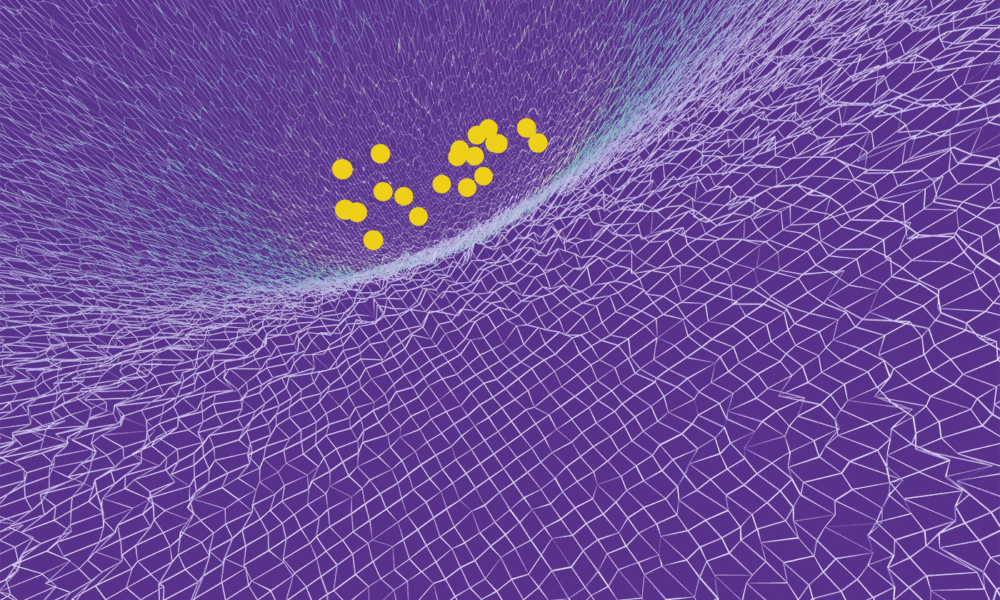
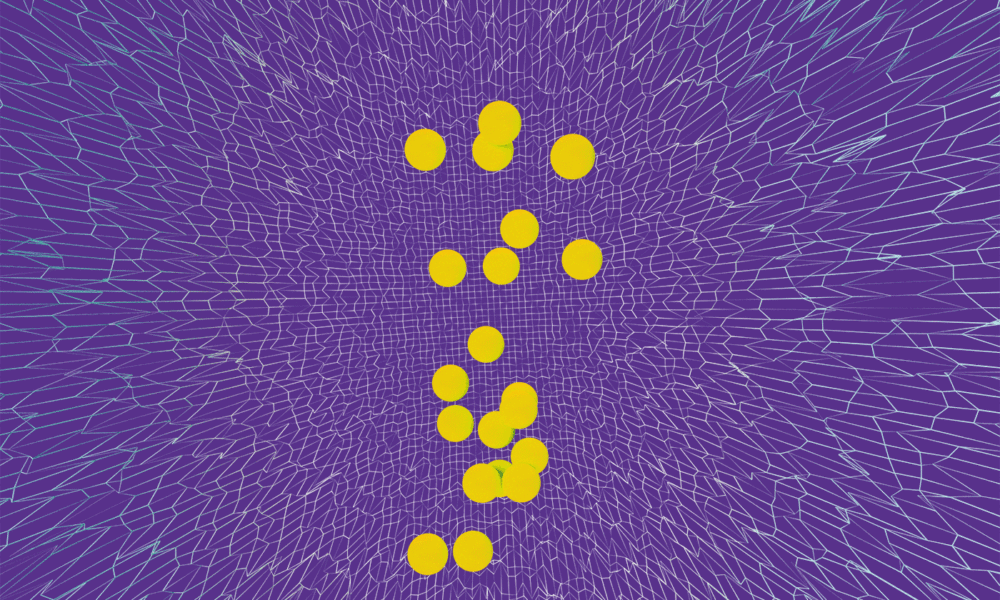
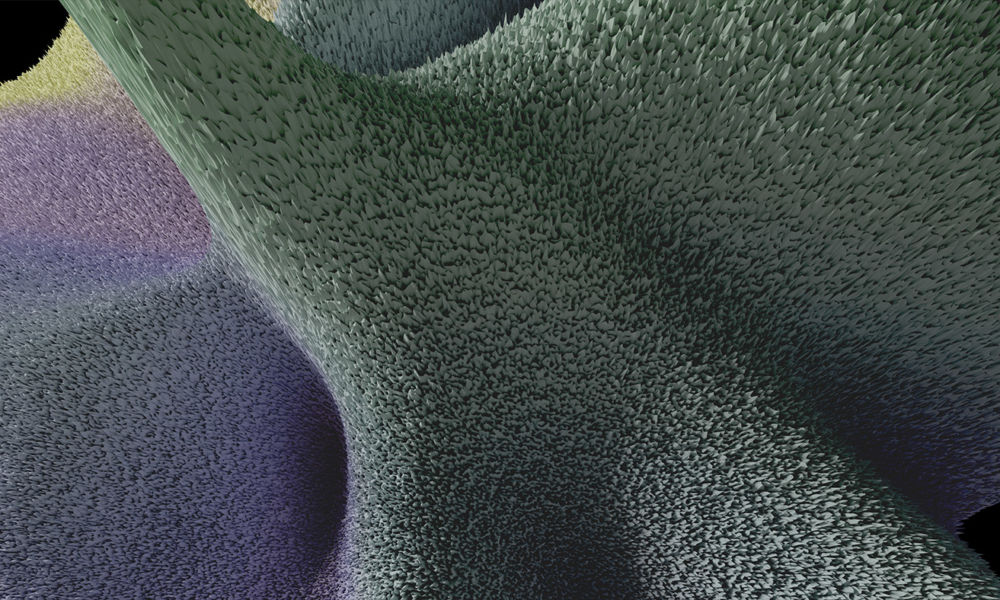
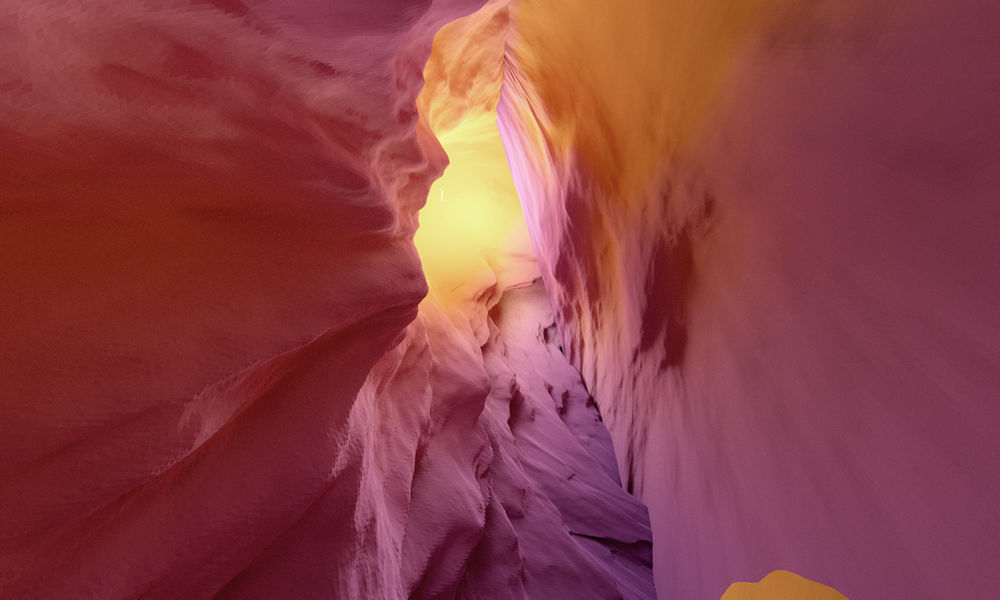
Loss Landscape Visualization. Visualizing the dynamics and morphology of these loss landscapes as the training process progresses in as much detail as possible, we increase our chances of generating valuable insights in connection with deep learning and its optimization processes. Infographic created by Javier IdeamiMODE CONNECTIVITY. Visualization data generated through a collaboration between Pavel Izmailov (@Pavel_Izmailov), Timur Garipov (@tim_garipov) and Javier Ideami (@ideami). Based on the NeurIPS 2018 paper by Timur Garipov, Pavel Izmailov, Dmitrii Podoprikhin, Dmitry Vetrov, Andrew Gordon Wilson: https://arxiv.org/abs/1802.10026 | Creative visualization and artwork produced by Javier Ideami.ICARUS. Mode Connectivity. Visualization data generated through a collaboration between Pavel Izmailov (@Pavel_Izmailov), Timur Garipov (@tim_garipov) and Javier Ideami (@ideami). Based on the NeurIPS 2018 paper by Timur Garipov, Pavel Izmailov, Dmitrii Podoprikhin, Dmitry Vetrov, Andrew Gordon Wilson: https://arxiv.org/abs/1802.10026 | Creative visualization and artwork produced by Javier Ideami.GRADIENT X-RAY. Mode Connectivity. Visualization data generated through a collaboration between Pavel Izmailov (@Pavel_Izmailov), Timur Garipov (@tim_garipov) and Javier Ideami (@ideami). Based on the NeurIPS 2018 paper by Timur Garipov, Pavel Izmailov, Dmitrii Podoprikhin, Dmitry Vetrov, Andrew Gordon Wilson: https://arxiv.org/abs/1802.10026 | Creative visualization and artwork produced by Javier Ideami. This artwork shows the area of the two minima and also higher loss areas which contain irregular morphology.GRADIENT THEATER. Mode Connectivity. Visualization data generated through a collaboration between Pavel Izmailov (@Pavel_Izmailov), Timur Garipov (@tim_garipov) and Javier Ideami (@ideami). Based on the NeurIPS 2018 paper by Timur Garipov, Pavel Izmailov, Dmitrii Podoprikhin, Dmitry Vetrov, Andrew Gordon Wilson: https://arxiv.org/abs/1802.10026 | Creative visualization and artwork produced by Javier Ideami. This artwork shows the area of the two minima and also higher loss areas which contain irregular morphology.ReLU-Mish-Swish. Loss Landscape Morphology Studies. Project by Ajay uppili arasanipalai, Diganta misra, Trikay nalamada and Javier ideami within the Landskape deep learning research group projects.DROP. visualizes changes produced in the loss landscape as the dropout hyperparameter is gradually increased. Loss Landscape generated with real data: Convnet, imagenette dataset, sgd-adam, bs=16, bn, lr sched, train mod, 250k pts, 20p-interp, log scaled (orig loss nums) & vis-adapted, When analyzing the loss landscape generated while increasing dropout, we see a noise layer gradually taking over the landscape, a layer that is disruptive enough to help in preventing overfitting and the memorization of paths and routes across the landscape, and yet not disruptive enough to prevent convergence to a good minima (unless dropout is taken to extreme values).DROP. visualizes changes produced in the loss landscape as the dropout hyperparameter is gradually increased. Loss Landscape generated with real data: Convnet, imagenette dataset, sgd-adam, bs=16, bn, lr sched, train mod, 250k pts, 20p-interp, log scaled (orig loss nums) & vis-adapted, When analyzing the loss landscape generated while increasing dropout, we see a noise layer gradually taking over the landscape, a layer that is disruptive enough to help in preventing overfitting and the memorization of paths and routes across the landscape, and yet not disruptive enough to prevent convergence to a good minima (unless dropout is taken to extreme values).DROP. visualizes changes produced in the loss landscape as the dropout hyperparameter is gradually increased. Loss Landscape generated with real data: Convnet, imagenette dataset, sgd-adam, bs=16, bn, lr sched, train mod, 250k pts, 20p-interp, log scaled (orig loss nums) & vis-adapted, When analyzing the loss landscape generated while increasing dropout, we see a noise layer gradually taking over the landscape, a layer that is disruptive enough to help in preventing overfitting and the memorization of paths and routes across the landscape, and yet not disruptive enough to prevent convergence to a good minima (unless dropout is taken to extreme values).DROP. visualizes changes produced in the loss landscape as the dropout hyperparameter is gradually increased. Loss Landscape generated with real data: Convnet, imagenette dataset, sgd-adam, bs=16, bn, lr sched, train mod, 250k pts, 20p-interp, log scaled (orig loss nums) & vis-adapted, When analyzing the loss landscape generated while increasing dropout, we see a noise layer gradually taking over the landscape, a layer that is disruptive enough to help in preventing overfitting and the memorization of paths and routes across the landscape, and yet not disruptive enough to prevent convergence to a good minima (unless dropout is taken to extreme values).EDGE HORIZON. Loss Landscape created with data from the training process of a convolutional network. Imaginette Dataset. Sgd-Adam, train mode, 1 million points, log scaled.X-Ray Transformer. X-Ray Transformer, dive into transformers training & inference computations through a single visual. An all in one x-ray of the model that gave rise to GPT.LL Library. visualizes a concept prototype for a library of loss landscapes. The loss landscapes featured are created with real data, using Resnet 20 arquitectures, with batch sizes of 16 and 128 and the Adam optimizer. This is part of an ongoing project.LL Library. visualizes a concept prototype for a library of loss landscapes. The loss landscapes featured are created with real data, using Resnet 20 arquitectures, with batch sizes of 16 and 128 and the Adam optimizer. This is part of an ongoing project.LL Library. visualizes a concept prototype for a library of loss landscapes. The loss landscapes featured are created with real data, using Resnet 20 arquitectures, with batch sizes of 16 and 128 and the Adam optimizer. This is part of an ongoing project.ReLU-Mish-Swish. Loss Landscape Morphology Studies. Project by Ajay uppili arasanipalai, Diganta misra, Trikay nalamada and Javier ideami within the Landskape deep learning research group projects.ReLU-Mish-Swish. Loss Landscape Morphology Studies. Project by Ajay uppili arasanipalai, Diganta misra, Trikay nalamada and Javier ideami within the Landskape deep learning research group projects.ReLU-Mish-Swish. Loss Landscape Morphology Studies. Project by Ajay uppili arasanipalai, Diganta misra, Trikay nalamada and Javier ideami within the Landskape deep learning research group projects.LOTTERY. visualizes the performance of a Resnet18 (Mnist dataset) as the weights of the network are gradually being pruned (based on arxiv:1803.03635 by jonathan frankle, michael carbin). Up to 80% pruning it can be observed in this specific network that the performance of the retrained networks with pruned weights can equal or exceed the original one when evaluating the test dataset. Loss Landscape generated with real data: resnet18 / mnist, sgd-adam, bs=60, lr sched, eval mod, log scaled (orig loss nums) & vis-adapted.LOTTERY. visualizes the performance of a Resnet18 (Mnist dataset) as the weights of the network are gradually being pruned (based on arxiv:1803.03635 by jonathan frankle, michael carbin). Up to 80% pruning it can be observed in this specific network that the performance of the retrained networks with pruned weights can equal or exceed the original one when evaluating the test dataset. Loss Landscape generated with real data: resnet18 / mnist, sgd-adam, bs=60, lr sched, eval mod, log scaled (orig loss nums) & vis-adapted.EDGE OF NOISE. Loss Landscape created with data from the training process of a convolutional network that uses dropout. The use of dropout produces this distinctive morphology and sharp patterns during the training processCOLUMN DESCENT. External view of the area leading to a minima. The area reminds of the top part of a column. Loss Landscape created with data from the training process of a convolutional network.CONVEX PARADE. Comparison of morphology features 10 epochs after the beginning of the training/eval process. From left to right and top to bottom: a) no bn, bs=16, train epoch 10, 79.8% acc b) no bn, bs=16, eval epoch 10, 68.5% acc c) bn, bs=16, train epoch 10, 79.6% acc d) bn, bs=16, eval epoch 10, 75% acc e) bn, bs=2, train epoch 10, 53.6% acc f) no bn, bs=16, drop 0.07, train epoch 10, 51.5% acc g) bn, bs=16, drop 0.07, train epoch 10, 59.6% acc h) bn, bs=128, train epoch 10, 82.3% acc i) bn, bs=128, eval epoch 10, 70% acc j) bn, bs=2, eval epoch 10, 59.5% accEDGE HORIZON APPROACH. Loss Landscape created with data from the training process of a convolutional network. Imaginette Dataset. Sgd-Adam, train mode, 1 million points, log scaled.Loss Landscape created with data from the training process of a convolutional network. Imaginette Dataset. Sgd-Adam, train mode, 1 million points, log scaled.UNCERTAIN DESCENT. swa-gaussian (swag). a simple baseline for bayesian uncertainty in deep learning. Based on the paper by wesley maddox, timur garipov, pavel izmailov, dmitry vetrov, andrew gordon wilson. Visualization is a collaboration between pavel izmailov, timur garipov and javier ideami@losslandscape.com. NeurIPS 2019, ARXIV:1902.02476 | losslandscape.comBlessing of Dimensionality Infographic. Extra dimensions facilitate our optimization challenges. In high dimensional networks, the set of interpolating solutions is really large. Because of that, wherever your starting position is on the loss landscape, chances are very high that there is a local path somewhere close to your starting point that will take you to a good minima. Infographic created by Javier IdeamiEDGE HORIZON VIEW. Loss Landscape created with data from the training process of a convolutional network. Imaginette Dataset. Sgd-Adam, train mode, 1 million points, log scaled.FROM ABOVE. Mode Connectivity. Visualization data generated through a collaboration between Pavel Izmailov (@Pavel_Izmailov), Timur Garipov (@tim_garipov) and Javier Ideami (@ideami). Based on the NeurIPS 2018 paper by Timur Garipov, Pavel Izmailov, Dmitrii Podoprikhin, Dmitry Vetrov, Andrew Gordon Wilson: https://arxiv.org/abs/1802.10026 | Creative visualization and artwork produced by Javier Ideami. This artwork shows the area of the two minima and also higher loss areas which contain irregular morphology.UNCERTAIN DESCENT. swa-gaussian (swag). a simple baseline for bayesian uncertainty in deep learning. Based on the paper by wesley maddox, timur garipov, pavel izmailov, dmitry vetrov, andrew gordon wilson. Visualization is a collaboration between pavel izmailov, timur garipov and javier ideami@losslandscape.com. NeurIPS 2019, ARXIV:1902.02476 | losslandscape.comUNCERTAIN DESCENT. swa-gaussian (swag). a simple baseline for bayesian uncertainty in deep learning. Based on the paper by wesley maddox, timur garipov, pavel izmailov, dmitry vetrov, andrew gordon wilson. Visualization is a collaboration between pavel izmailov, timur garipov and javier ideami@losslandscape.com. NeurIPS 2019, ARXIV:1902.02476 | losslandscape.comUNCERTAIN DESCENT. swa-gaussian (swag). a simple baseline for bayesian uncertainty in deep learning. Based on the paper by wesley maddox, timur garipov, pavel izmailov, dmitry vetrov, andrew gordon wilson. Visualization is a collaboration between pavel izmailov, timur garipov and javier ideami@losslandscape.com. NeurIPS 2019, ARXIV:1902.02476 | losslandscape.comLATENT. visualizes the initial stages of the training of a Wasserstein GP GAN network, trained over the celebA dataset. This capture shows part of the loss landscape of the Generator after the first 820 training steps. The morphology and dynamics of the generator’s landscape around the minimizer are very diverse and change quickly, expressing the complexity of the generator’s task and the array of possible routes existing ahead. Loss Landscape generated with real data: wasserstein GP Gan, celebA dataset, sgd-adam, bs=64, train mod, 300k pts, 1 w range, latent space dimensions: 200, generator is sometimes reversed for visual purposes, critic is log scaled (orig loss nums) & vis-adapted.CANYONLAND. This abstract composition that resembles a canyon is created by combining 3 different loss landscapes generated with real data from training processes of the same convolutional network. The combination highlights the diversity of morphology and patterns that arise in loss surfaces. The 3 loss surfaces have been positioned in 3d space in a way that produces a narrow corridor. Loss Landscapes created with data from the training process of a convolutional network. Imaginette Dataset. SGD-Adam, train mode, 1 million points, log scaled.GRADIENT PARADE. Comparison of morphology features 10 epochs after the beginning of the training/eval process. From left to right and top to bottom: a) no bn, bs=16, train epoch 10, 79.8% acc b) no bn, bs=16, eval epoch 10, 68.5% acc c) bn, bs=16, train epoch 10, 79.6% acc d) bn, bs=16, eval epoch 10, 75% acc e) bn, bs=2, train epoch 10, 53.6% acc f) no bn, bs=16 drop 0.07, train epoch 10, 51.5% acc g) bn, bs=16 drop 0.07, train epoch 10, 59.6% acc h) bn, bs=128, train epoch 10, 82.3% acc i) bn, bs=128, eval epoch 10, 70% acc j) bn, bs=2, eval epoch 10, 59.5% acc
LL is led by Javier Ideami, A.I researcher, multidisciplinary creative director, engineer and entrepreneur. Contact Ideami on ideami@ideami.com