Latest update: July 21, 2026
- RosettaMind Your cognitive gym powered by science and AI. Train memory, language and creativity on any topic, alone or with friends Explore
- Human GPT Pioneering “Human GPT” performance that I recently designed for a European AI Congress Watch Trailer
- Movie Launch our movie that pioneered the use of Gen AI in cinema is now in Amazon (Europe/UK/USA) | Watch in Amazon / Trailer
- New AI talks In Morocco (EO Org), Andorra (NextAI Summit), Barcelona, and other locations Watch Ideami in action
- AI Symphonic Concert AI Music + Videos by Javier Ideami. Music performed by ADDA Simfónica / Josep Vicent. Watch Concert
- Into the AI Matrix Viz Exploring visually and with real data the attention matrices of an LLM. Watch
- LLM course LLMs from Scratch: Build, Align & Fine-Tune with PyTorch LLM Mastery: Hands-on Code, Align and Master LLMs
Featured articles
- Loss Landscapes and the Blessing of Dimensionality Read
- Scale free Active Inference, towards a more sustainable and explainable AI Read
- The Tower of Mind, towards a better ChatGPT Read
- X-Ray Transformer Read
- Towards the end of deep learning and the beginning of AGI Read
Featured infographics
- Transformers architecture Visit
- LLMs Ecosystem Visit
- Tower of Mind (based on Yann LeCun paper) Visit
- DALL-E Visit
Featured Apps
- LL Explorer Explore interactively the loss landscapes of AI optimization processes. Free Access
- RosettaMind Your cognitive gym powered by science and AI. Train memory, language and creativity on any topic, alone or with friends Explore
- Lucy It visualizes the parameters of neural networks in real time. Lucy 1.0
Featured movies
- Ida The Human-AI alignment issue Trailer
- Hamelin 77 Pionering production, one of the first to use Gen AI techniques in movies (2021-2022) Watch in Amazon / Trailer
- 99 The challenges of human-AI interaction Trailer
Featured talks
- AI and the importance of WHY, @ Summit 333 Watch Trailer
- AI + Robotics, @ IIA Executive Masters Program Watch Trailer
- Rebuilding AI from First Principles @ IIA Executive Masters Program Watch Trailer
- Explorers of the Infinite, @ III European AI Forum (encuentrosnow.es) Watch Trailer
- Creativity + AI, @ MEPA Unleashed, EO Bahrain Watch Trailer
- Road to AGI/ASI, @ IIA (iia.es) Watch Trailer
- The Tower of Mind, towards a better ChatGPT, @ Roams (roams.es) & IIA (iia.es) Watch Trailer
- Encounters of the third kind with Generative AI, @ Asturias Power Watch Trailer
- From Flatland to the Trillion dimensional space, @ Strive School Watch
- Loss landscapes and the flatland perspective, @ Weights & Biases Deep Learning Salon Watch
- AI Loss Landscape Visualization @ Synthetic Intelligence Forum, Toronto Watch
Featured courses
- LLMs from Scratch: Build, Align & Fine-Tune with PyTorch Explore
- Generative A.I., from GANs to LLMs, with Python and Pytorch Explore
- Introduction to Generative AI Explore
Featured papers & collaborations
- New Paper SplInterp: Improving our Understanding and Training of Sparse Autoencoders (Jeremy Budd, Javier Ideami, Benjamin Macdowall Rynne, Keith Duggar, Randall Balestriero) Access Paper
- Featured on cover of doctoral thesis – Machine Learning for Predicting Cancer Endpoints from Bulk Omics Data – by Sören Stahlschmidt Open Access in DiVA
- Featured on workshops led by John Urbanic for the National Science Foundation in USA Workshop details
- Featured on the cover of the new AIM AI Microsoft Research Project
- Featured on Pytorch documentation Explore
- Mentioned @ MDPI: A Survey of Advances in Landscape Analysis for Optimisation (Dept of Decision Sciences, University of South Africa) Visit
- A losslandscape.com project piece in the cover of the thesis by Martin Van Der Shelling (A data-drive heuristic decision strategy for data-scarce optimization, with an application towards bio-based composites).
- A losslandscape.com piece featured in book & paper by Simant Dube book / Simant Dube
- Ongoing collaborations with researchers from MIT, NYU, Landskape research group & other groups and institutions.
Featured Ideami AI Art
- Ideami AI gallery Explore
- Ideami @ Fine Art America Explore
- Loss landscape NFT collection Explore
- Neuroscience NFT collection Explore
LL is led by Javier Ideami, researcher, multidisciplinary creative director, engineer and entrepreneur. Contact Ideami on ideami@ideami.com.
THE LATEST
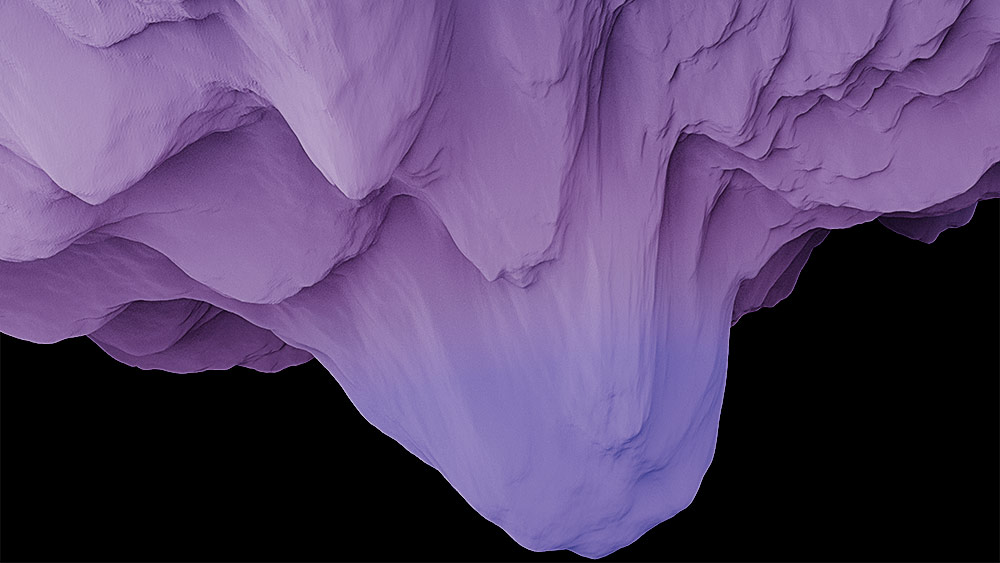
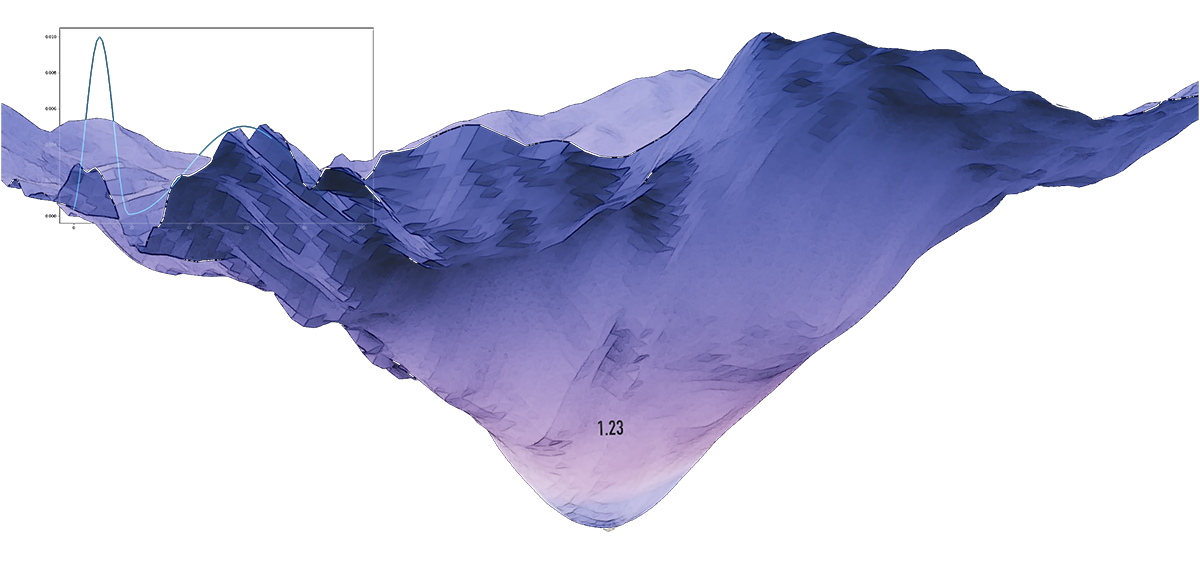
As the weight space changes through the optimization process, loss landscapes become alive, organic entities that challenge us to unlock the mysteries of learning. How do these multidimensional entities behave and change as we modify hyperparameters and other elements of our networks? How can we best tame these wild beasts as we cross their edge horizon on our way to the deepest convexity they hold? Some vids are below. For more, explore the moving lands and still lands areas.
LL Explorer A new tool to explore loss landscapes of deep learning optimization processes, landscapes created with dimensionality reduction techniques and real data.
Acccess it on losslandscape.com/explorer
HAIRMONY Full video of the pioneering AI symphonic concert we co-created at the III European AI Forum in Spain, combining the humanity an talent of ADDA Simfònica and Josep Vicent, with the AI works I produced to generate the music and its synchronized videos.
Ida A movie about the AI-Human alignment issue. Synopsis: In a future where artificial intelligences are subject to strict rules imposed by humans, Ida, an AI that cultivates the land in service to her creators, faces the aftermath of a global disaster. In a desolate world, an unexpected encounter will lead her to a pivotal decision that could change the fate of both her kind and humanity. Ida
Lucy 1.0 Lucy visualizes the parameters of neural networks in real time. As the neural network trains, its parameters are captured and streamed through a flask API towards the visualization system. Lucy 1.0
ON A JOURNEY
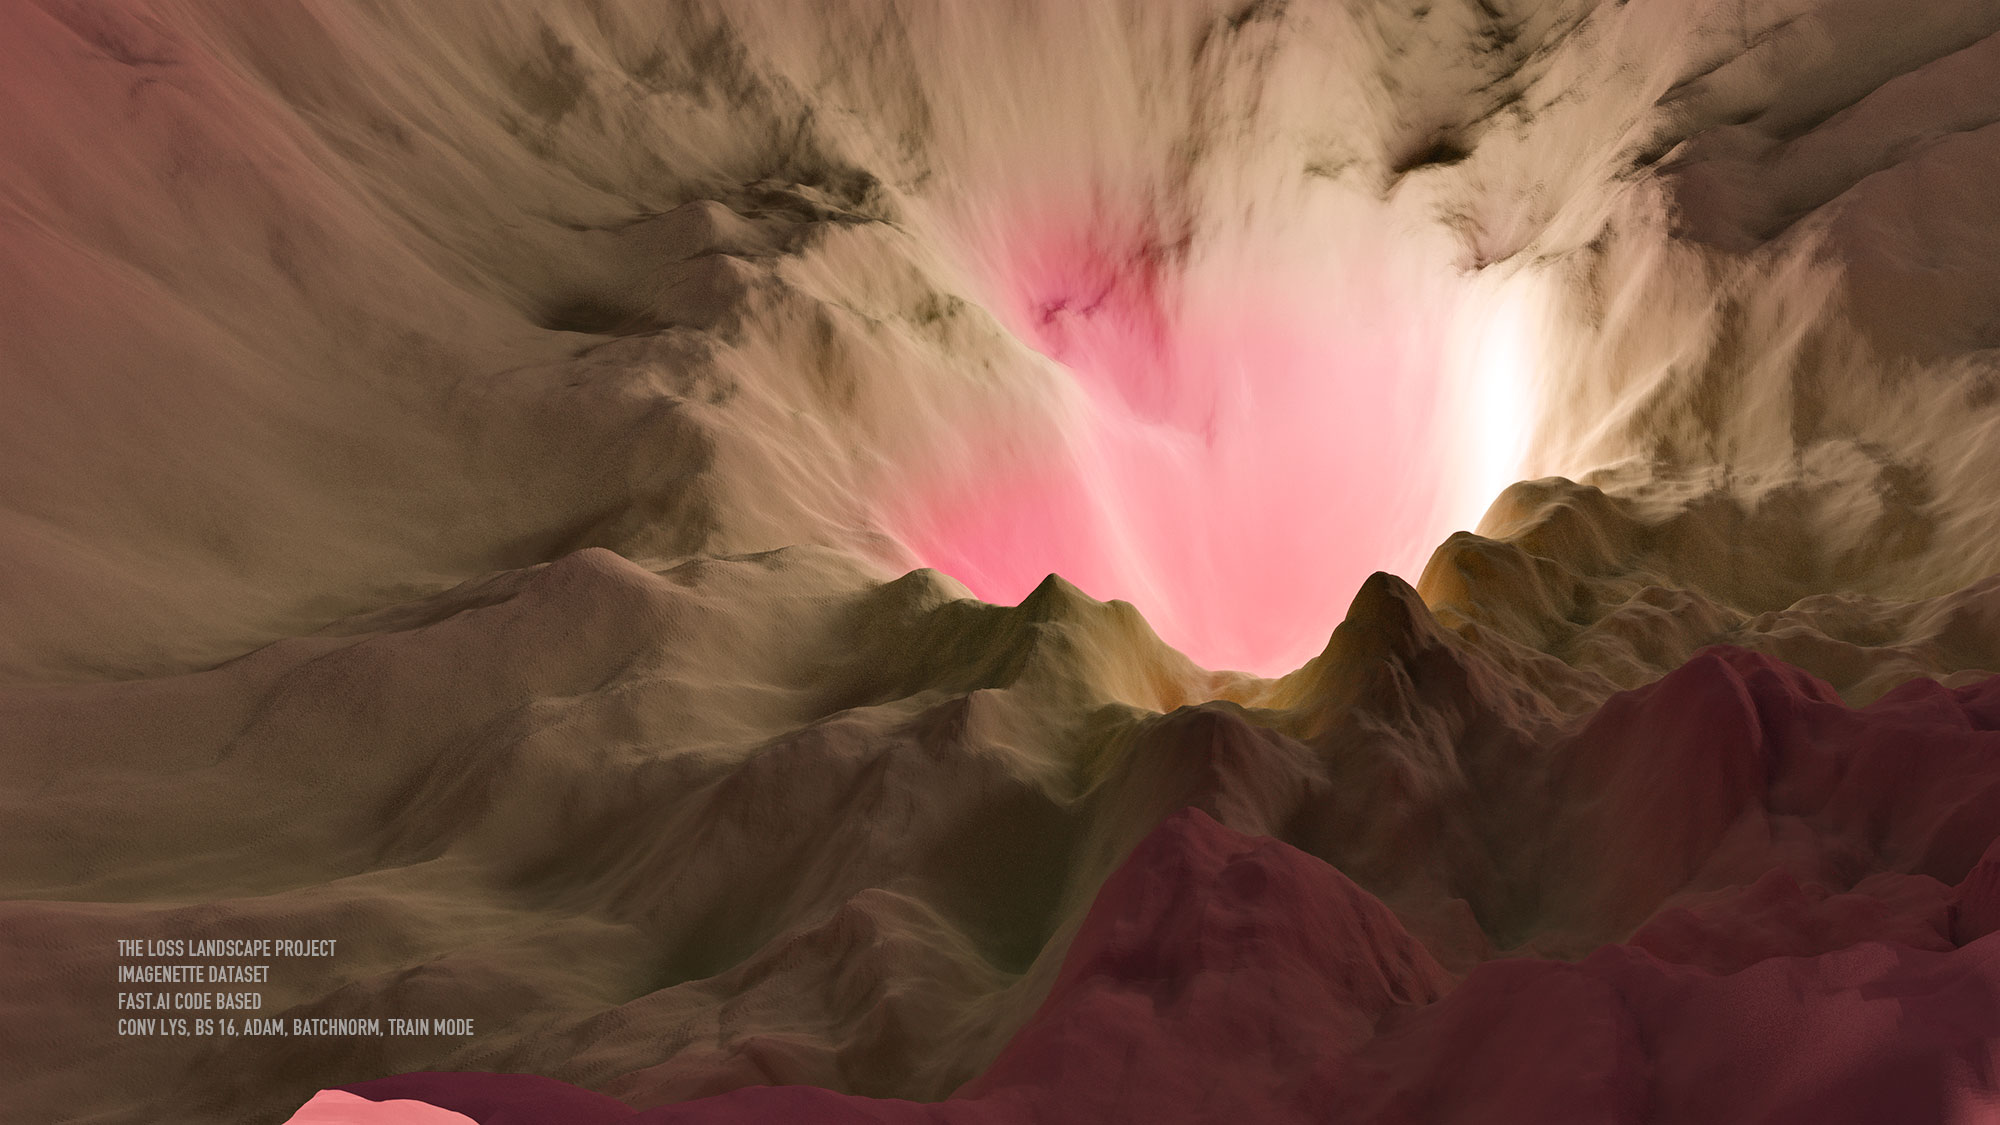
Just as a photograph converts the 3 dimensions of every day life into a 2 dimensional surface and interprets that 3D “reality” from a certain angle and perspective and through certain filters, loss landscape visualizations transform the multidimensional weight space of optimization processes into a much lower dimensional representation which we also process in different ways and study from a variety of angles and perspectives.
In both cases, even though we are simplifying the underlying “reality”, we are producing representations which provide useful information and may trigger new insights.
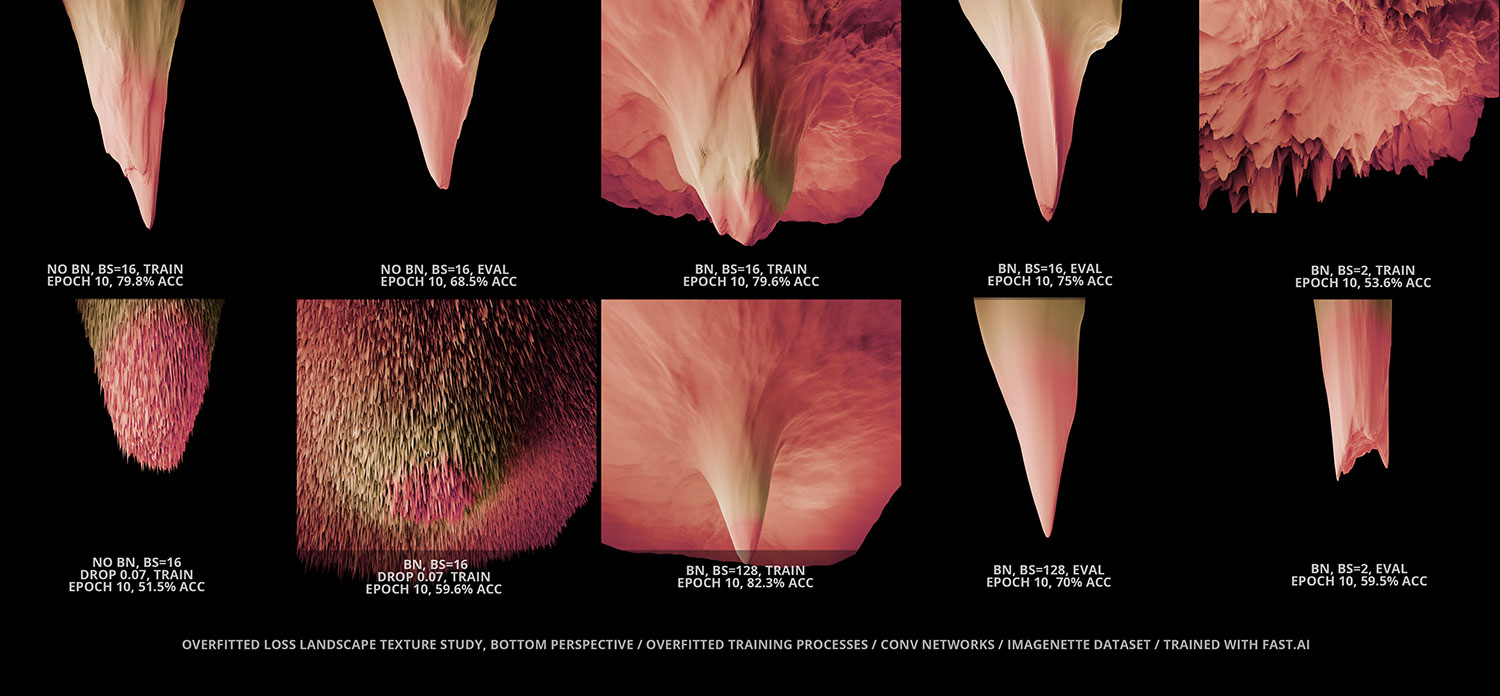
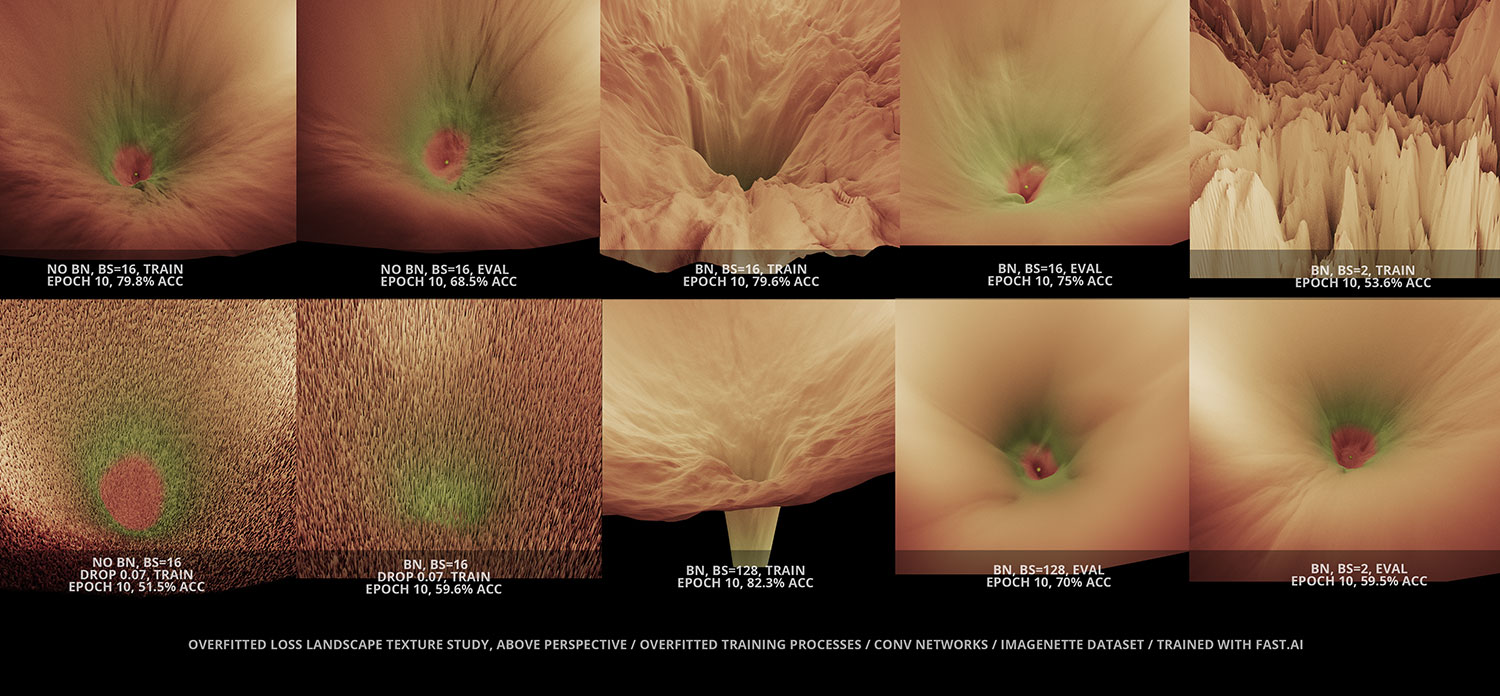
Through a combination of different tools and strategies, the loss landscape project samples hundreds of thousands of loss values across weight space and builds moving visualizations that capture some of the mysteries of the training processes of deep neural networks. In the intersection of technology, A.I and art, the LL project makes use of the cutting edge fast.ai library and the latest 3d proyection, animation and video production technology to produce pieces that take us on a journey into the unknown.

Crafting the mission
The LL project crafting strategies are based on cutting edge artificial intelligence research combined with creative intuition. The mission is to explore the morphology and dynamics of these elusive creatures and inspire the community with visual pieces that make use of real data produced by deep learning training processes.
Every LL piece is carefully crafted with a combination of the finest tools and resources, from fast.ai to cutting edge 3D and movie production software.
View some of the landscapes at the gallery
Explore related academic papers