Loss
Exploring the Landscape
Deep learning Explorers
MOVING LANDS
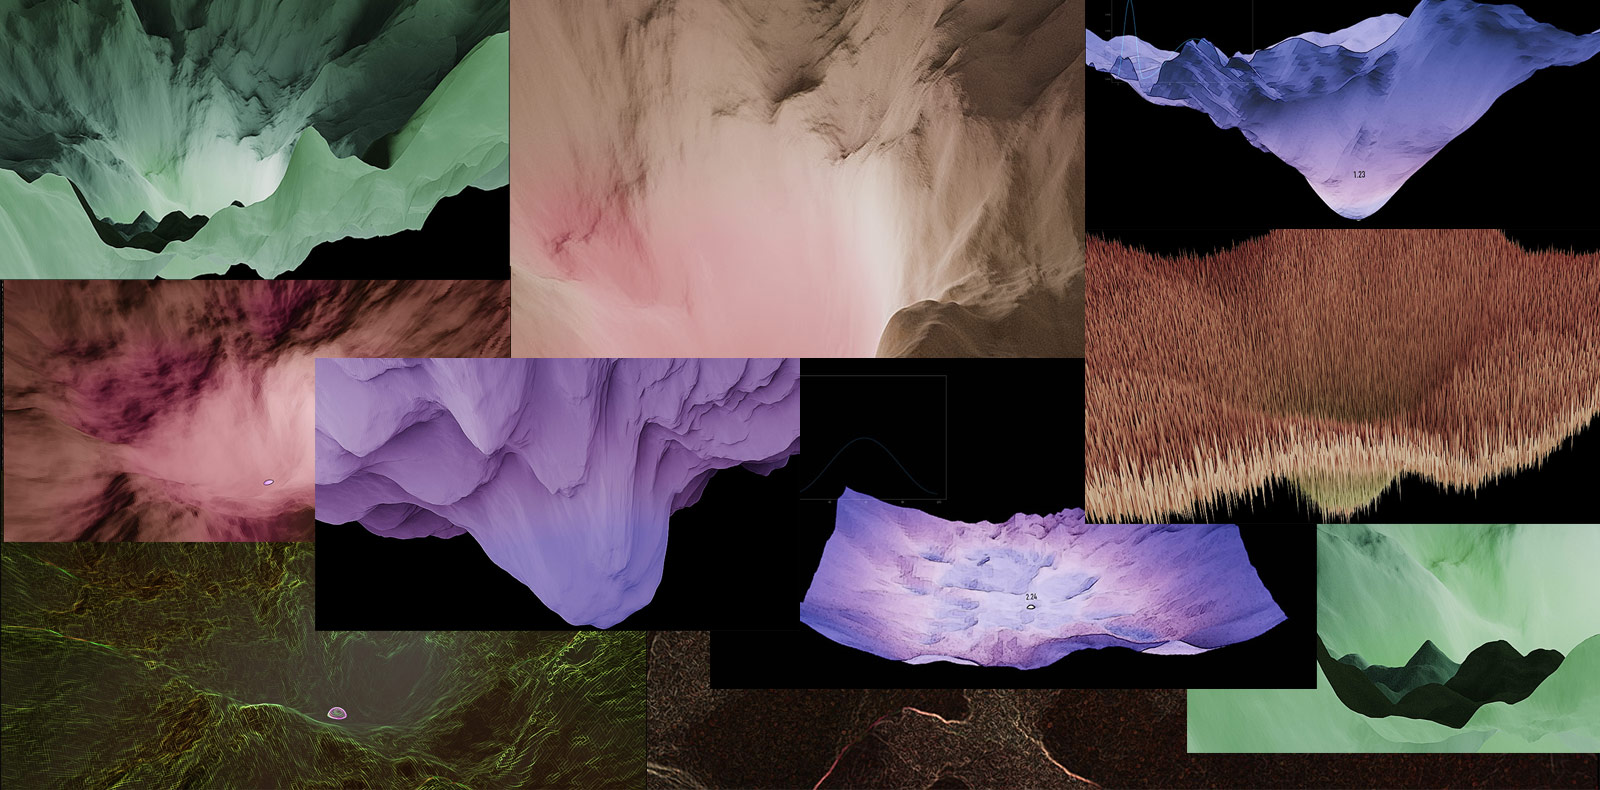
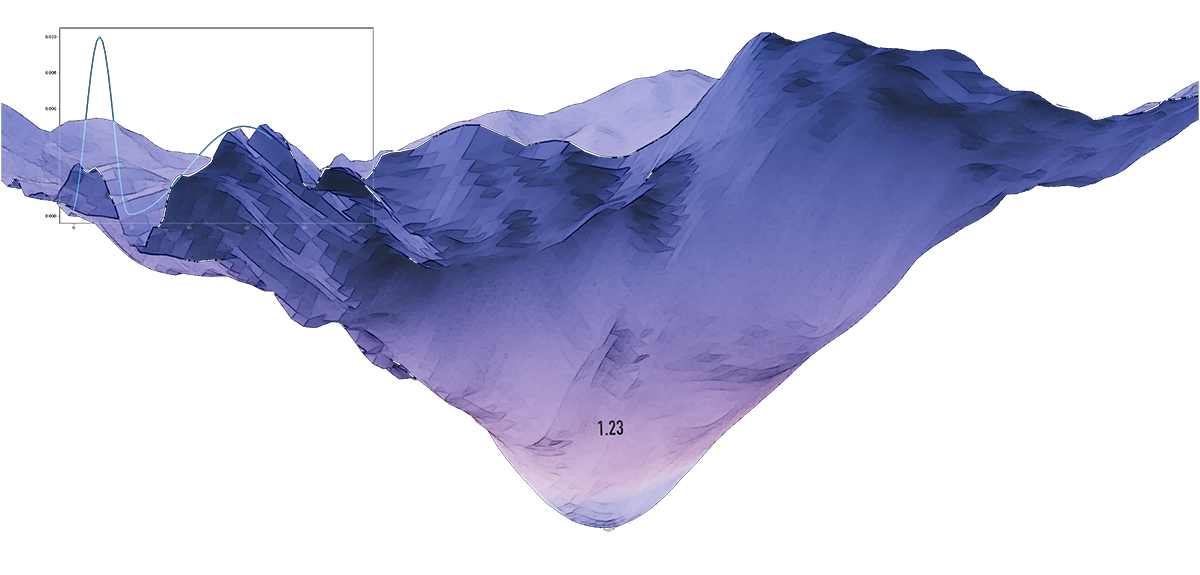
STILL LANDS
METHOD

Going deep
Latest update: May 5, 2020
- Ongoing collaborations with researchers from MIT, NYU and other groups and institutions
- LATENT, LL viz of the LL of a Wasserstein GP GAN
- ICARUS, new LL visualization is live, using real data to visualize mode connectivity
- UNCERTAIN DESCENT. SWAG NeurIPS 2019 visualization ready
- Collab with Landskape group’s DL research is progressing
- LL visualization active on the new home page of company Neural Concept
- A.I Fine Art Gallery at ideami.pixels.com
- Project Interestellar in planning stages
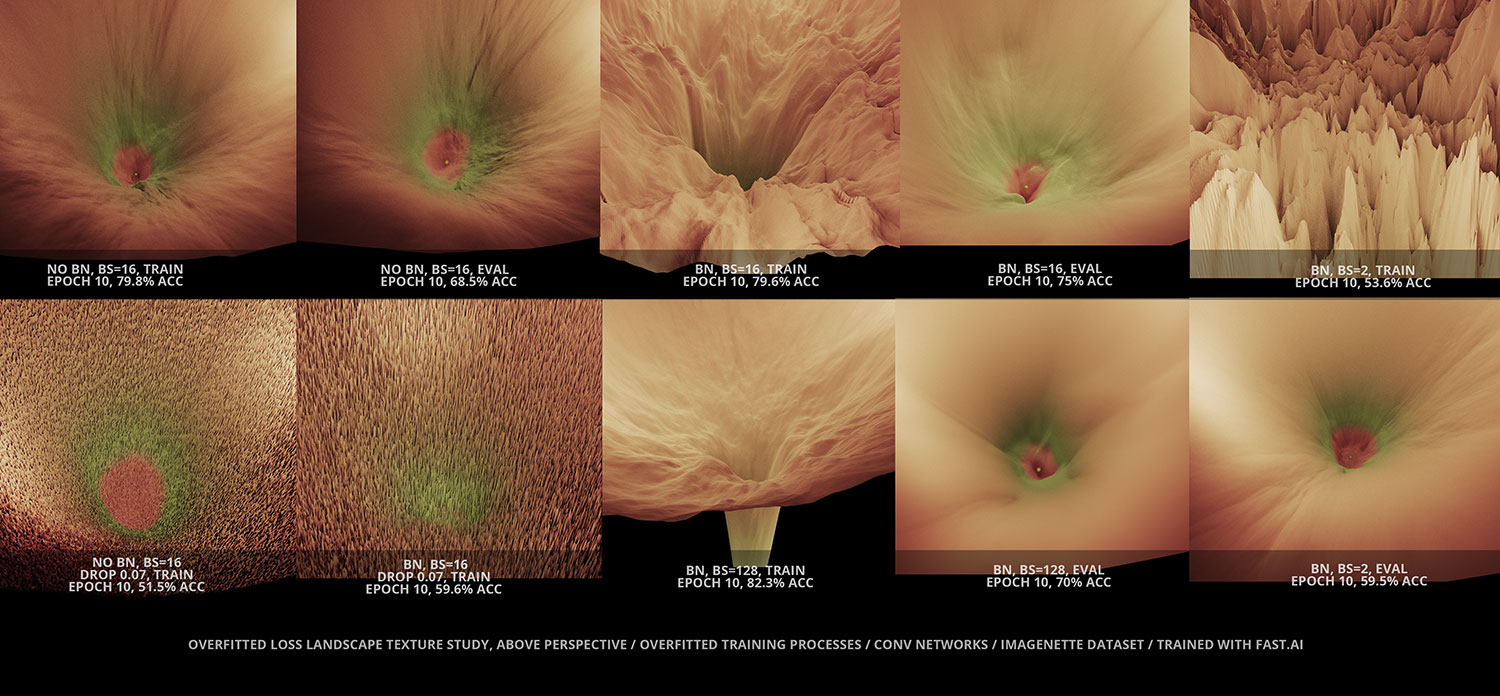
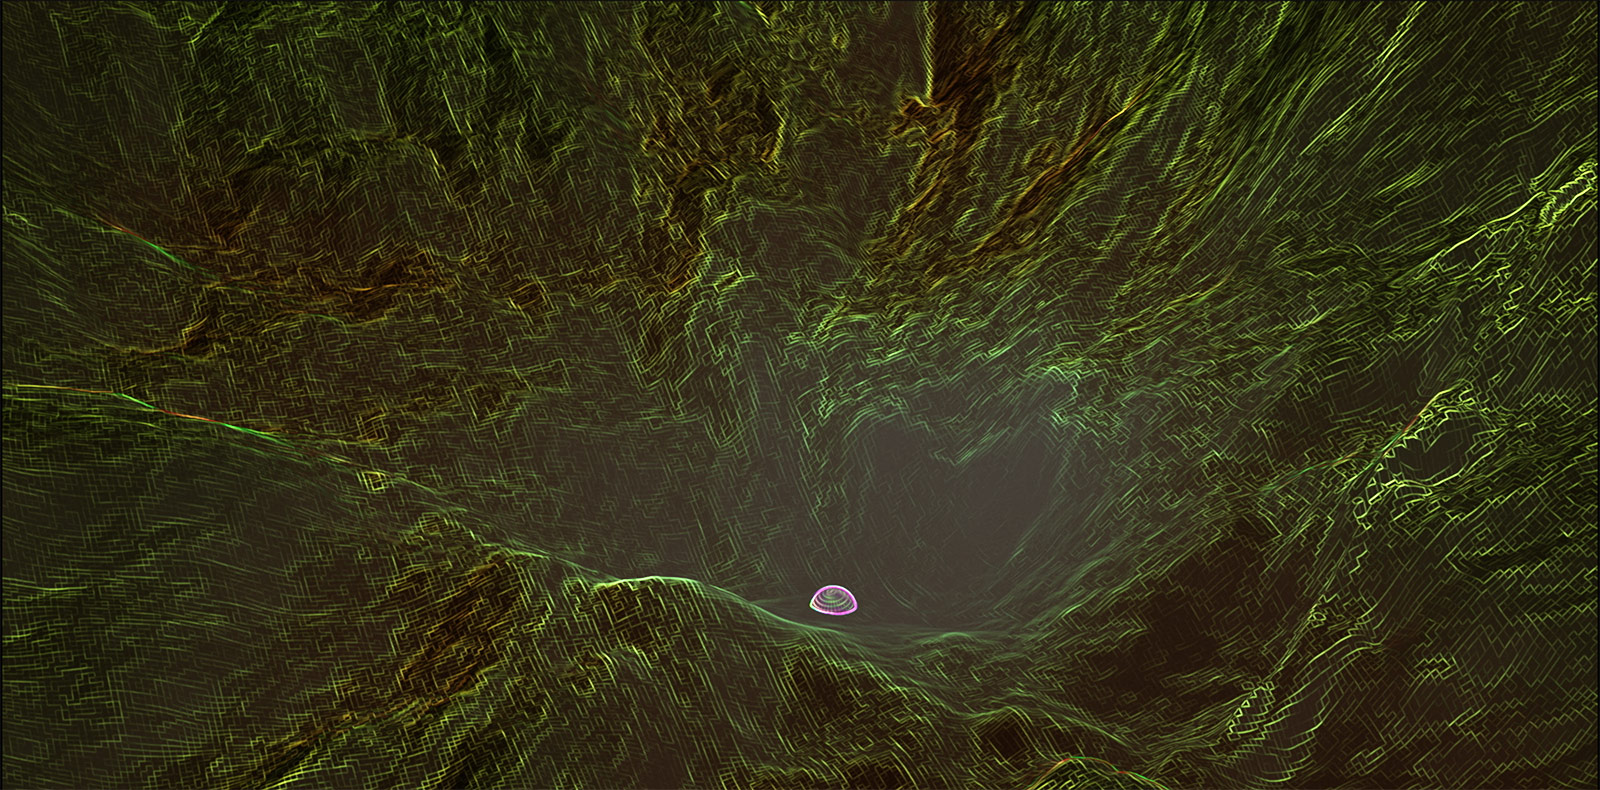
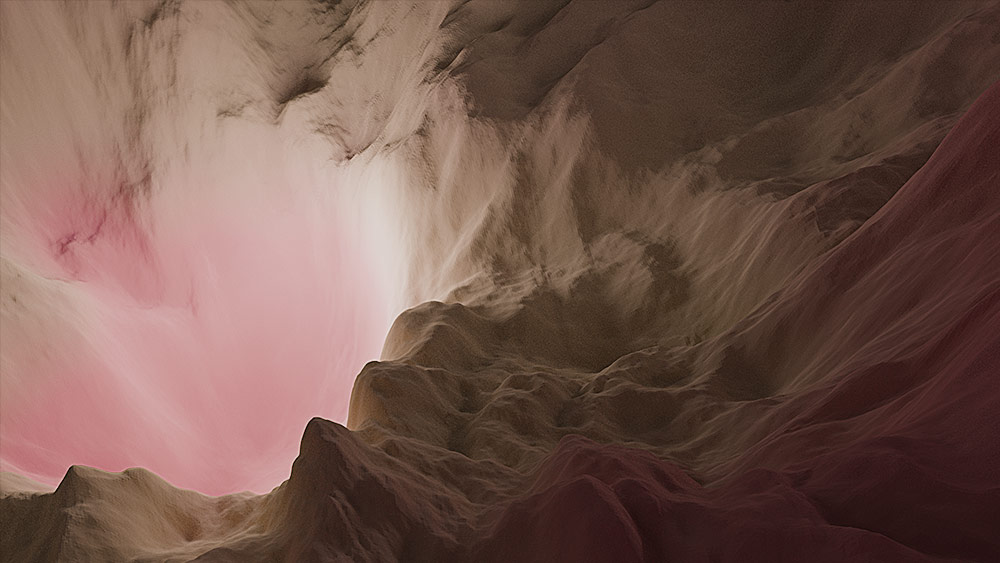
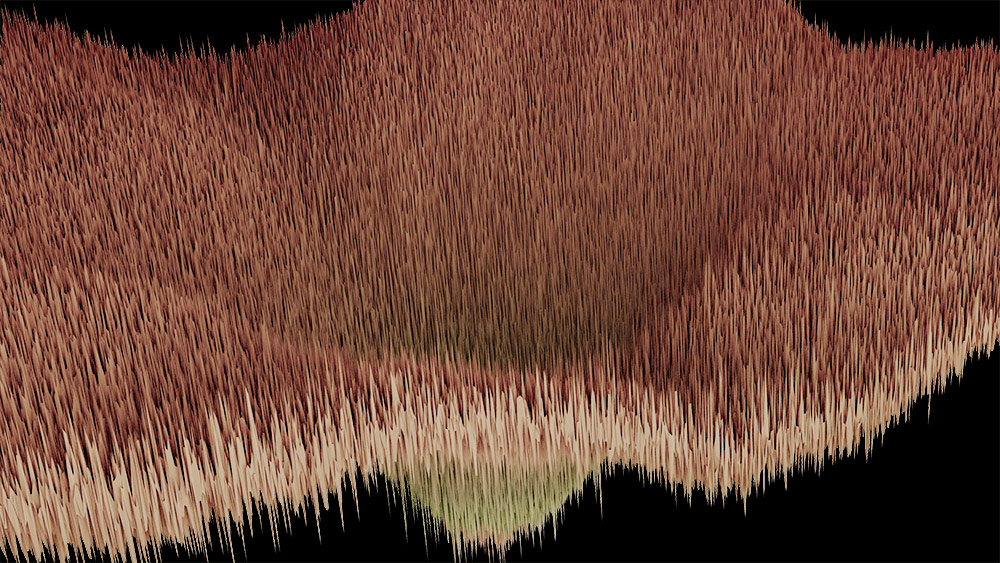
In the intersection between research and art, the A.I LL project explores the morphology and dynamics of the fingerprints left by deep learning optimization training processes. The project goes deep into the training phase of these processes and generates high quality visualizations, using some of the latest deep learning and machine learning research and producing inspiring animations that can both inform and inspire the community. As the weight space changes through the optimization process, loss landscapes become alive, organic entities that challenge us to unlock the mysteries of learning. How do these multidimensional entities behave and change as we modify hyperparameters and other elements of our networks? How can we best tame these wild beasts as we cross their edge horizon on our way to the deepest convexity they hold?
LL is led by Javier Ideami, researcher, multidisciplinary creative director, engineer and entrepreneur. Contact Ideami on ideami@ideami.com
THE LATEST
Some of the latest visualizations of the LL project. For more, check the moving lands and still lands areas.
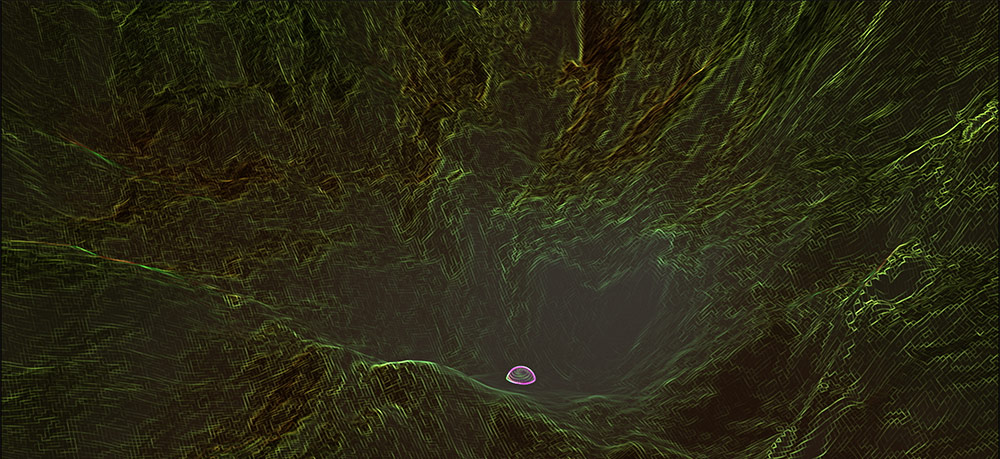
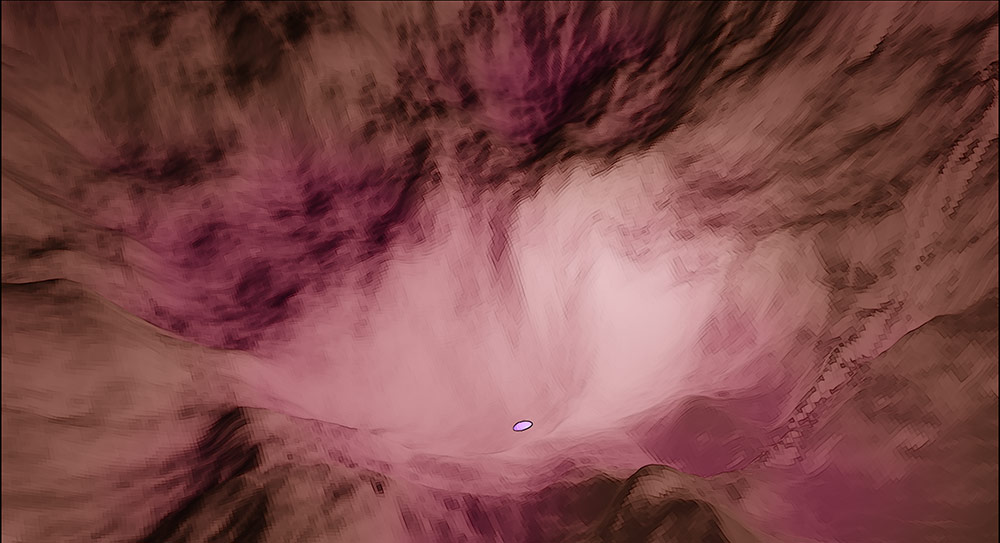
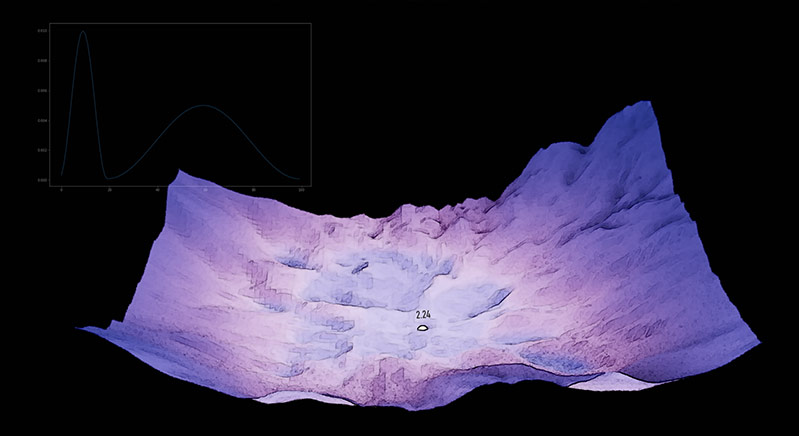
LATENT visualizes the initial stages of the training of a Wasserstein GP GAN network, trained over the celebA dataset. The first part of the video shows the first 1K steps of the training, and the final part shows the steps from 10K to 11K. The middle part shows part of the loss landscape of the Generator after the first 820 training steps. The morphology and dynamics of the generator’s landscape around the minimizer are very diverse and change quickly, expressing the complexity of the generator’s task and the array of possible routes existing ahead. Loss Landscape generated with real data: wasserstein GP Gan, celebA dataset, sgd-adam, bs=64, train mod, 300k pts, 1 w range, latent space dimensions: 200, generator is sometimes reversed for visual purposes, critic is log scaled (orig loss nums) & vis-adapted.
UNCERTAIN DESCENT. NeurIPS 2019, ARXIV:1902.02476 / swa-gaussian (swag). a simple baseline for bayesian uncertainty in deep learning.
Real Data visualizations using PCA directions. From the authors of the paper: “Machine learning models are used to make decisions, and representing uncertainty is crucial for decision making, especially in safety-critical applications. Deep learning models trained by minimizing the loss on the train dataset tend to provide overconfident and miscalibrated predictions because they ignore uncertainty over the parameters of the model. In Bayesian machine learning we account for this uncertainty: we form a distribution over the weights of the model, known as posterior. This distribution captures different models that all explain train data well, but provide different predictions on the test data. For Neural networks the posterior distribution is very complex: there is no way to compute it exactly and we have to approximate it. A key challenge for approximate inference methods is to capture the geometry of the posterior distribution or, equivalently, the loss landscape.
The idea of our SWAG is to extract the information about the posterior geometry from the SGD trajectory. We start by pre-training a Neural Network with SGD, Adam or any other optimizer, to get a good initial solution. This part is the same as the standard training of the model. Starting from the pre-trained solution, we run SGD with a high constant learning rate. In this setting instead of converging to a single solution, SGD would bounce around different solutions that all explain the train data well. We then construct a Gaussian distribution that captures these different solutions traversed by SGD, and use it as our approximation to the posterior. It turns out that this simple procedure captures the local Geometry of the posterior remarkably well.”
Based on the paper by wesley maddox, timur garipov, pavel izmailov, dmitry vetrov, andrew gordon wilson. Visualization is a collaboration between pavel izmailov, timur garipov and javier ideami@losslandscape.com. NeurIPS 2019, ARXIV:1902.02476 | losslandscape.com..
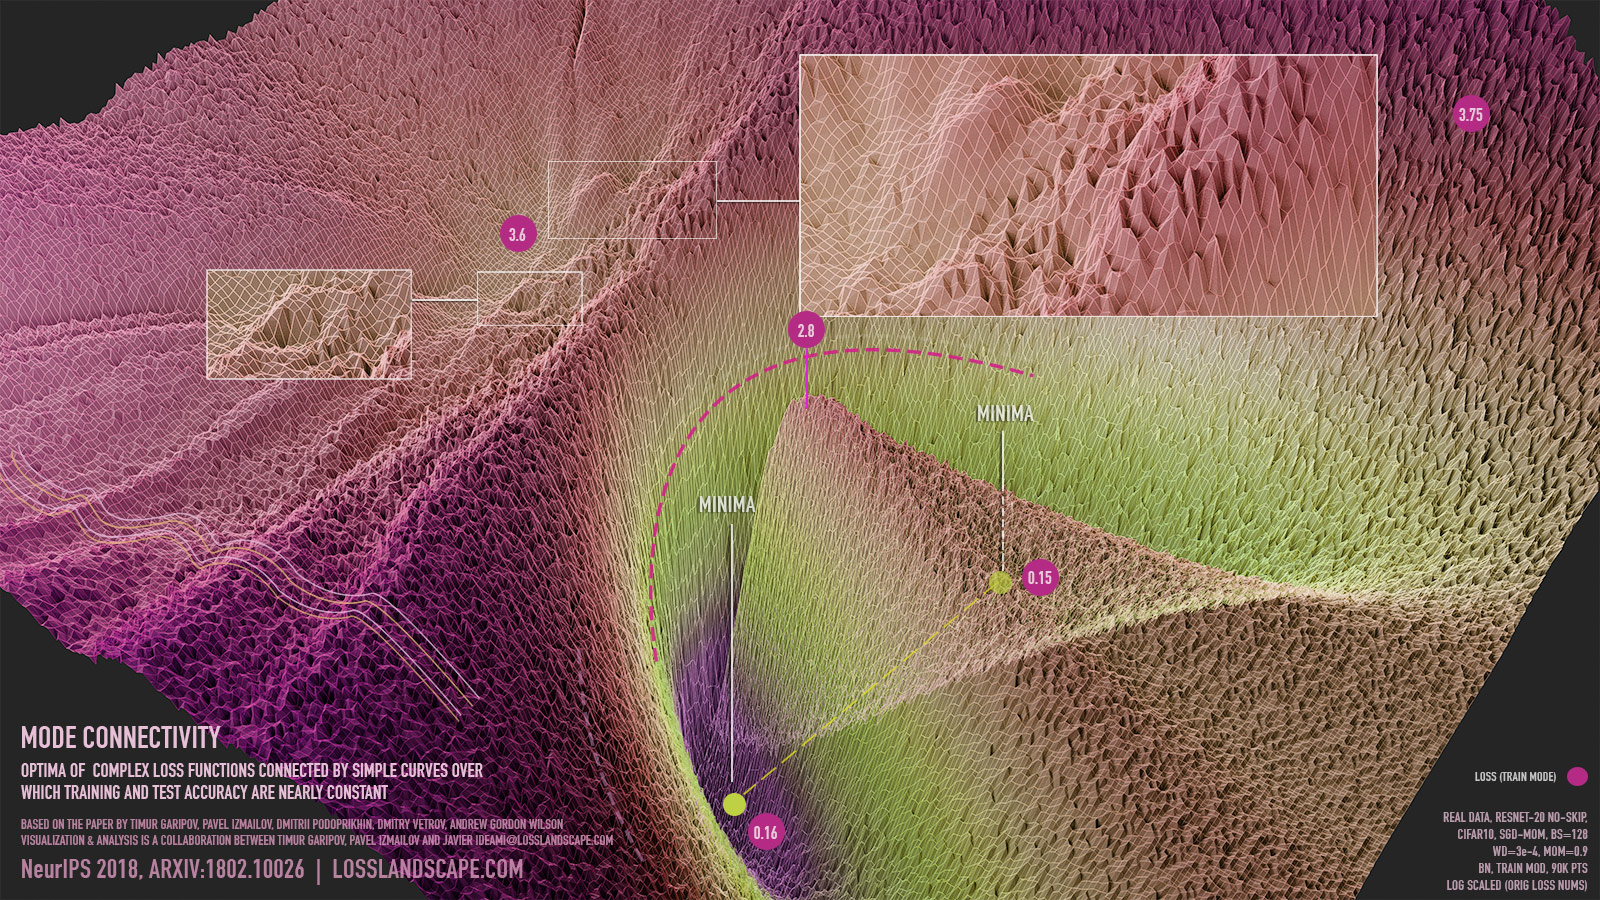
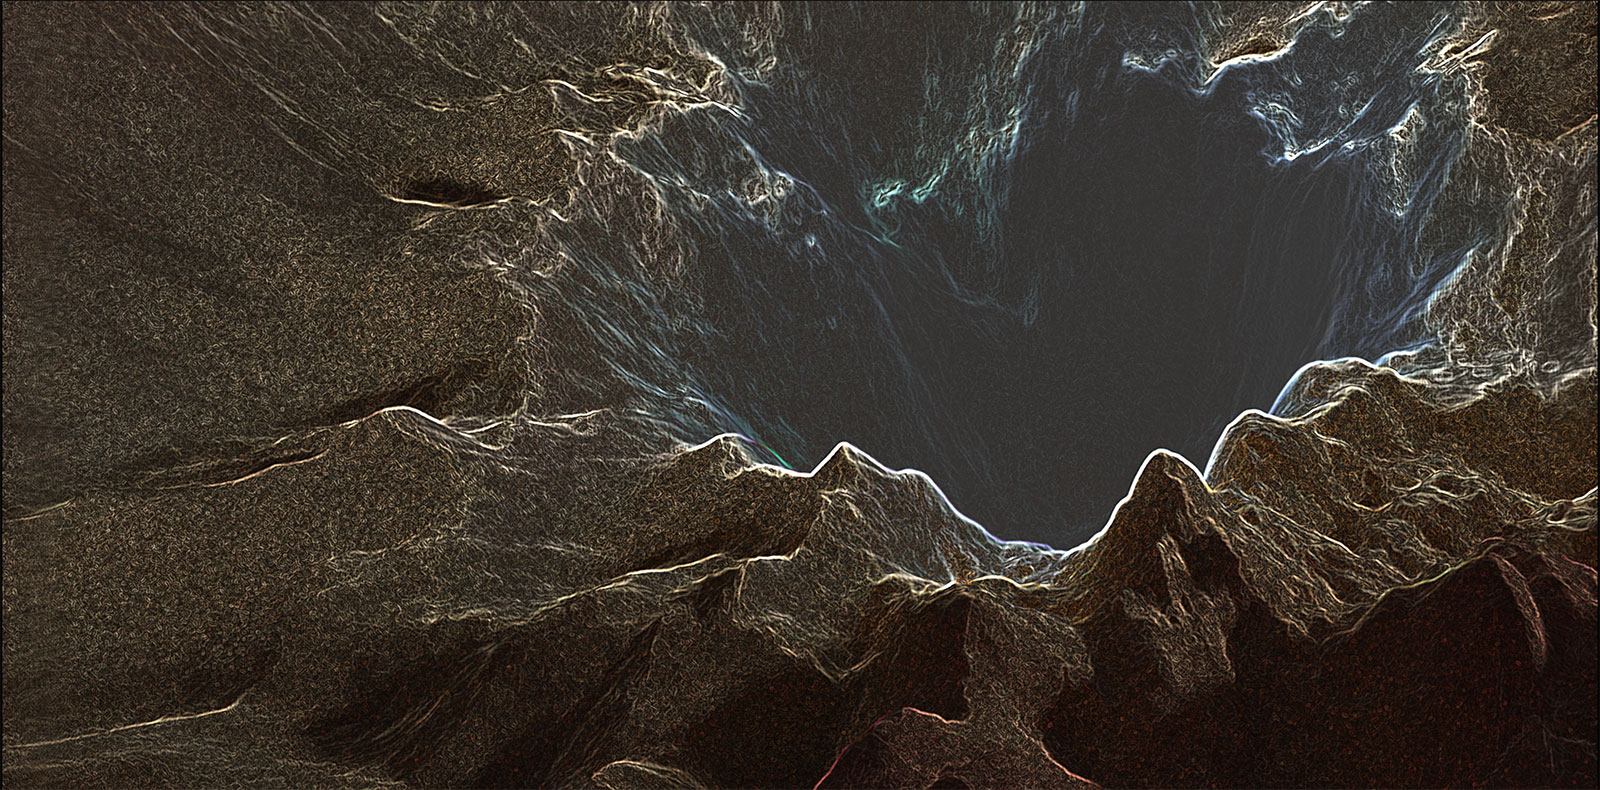
ICARUS Mode Connectivity. NeurIPS 2018 ARXIV/1802.10026. Optima of complex loss functions connected by simple curves over which training and test accuracy are nearly constant. Icarus uses real data and showcases the training process that connects two optima through a pathway generated with a bezier curve. To create ICARUS, 15 GPUs were used over more than 2 weeks to produce over 50 million loss values. The entire process end to end took over 4 weeks of work.
As Wikipedia states, “In Greek mythology, Icarus is the son of the master craftsman Daedalus, the creator of the Labyrinth. Icarus and his father attempt to escape from Crete by means of wings that his father constructed from feathers and wax.”. We can think of the loss landscape as another labyrinth where our “escape” is to find a low enough valley, one of those optimas we are searching for. But this is no ordinary labyrinth, for ours is highly dimensional, and unlike in traditional labyrinths, in our loss landscape it is possible to find shortcuts that can connect some of those optima. So just as Icarus and his father make use of special wings to escape Crete, the creators of the paper combine simple curves (a bezier in this specific video) and their custom training process to escape the isolation between the optima, demonstrating that even though straight lines between the optima must cross hills of very high loss values, there are other pathways that connect them, through which training and test accuracy remain nearly constant. On top of the above, the morphology of the two connected optima in this video, also resembles a set of wings. These wings come to life in the strategies used by these modern “Icarus” like scientists as they find new ways to escape the isolation of the optima present in these kinds of loss landscapes.
Visualization data generated through a collaboration between Pavel Izmailov (@Pavel_Izmailov), Timur Garipov (@tim_garipov) and Javier Ideami (@ideami). Based on the NeurIPS 2018 paper by Timur Garipov, Pavel Izmailov, Dmitrii Podoprikhin, Dmitry Vetrov, Andrew Gordon Wilson: https://arxiv.org/abs/1802.10026 | Creative visualization and artwork produced by Javier Ideami.
Mode Connectivity. NeurIPS 2018 ARXIV/1802.10026. Optima of complex loss functions connected by simple curves over which training and test accuracy are nearly constant. Visualization data generated through a collaboration between Pavel Izmailov (@Pavel_Izmailov), Timur Garipov (@tim_garipov) and Javier Ideami (@ideami). Based on the paper by timur garipov, pavel izmailov, dmitrii podoprikhin, dmitry vetrov, andrew gordon wilson: https://arxiv.org/abs/1802.10026 | creative visualization produced by Javier Ideami. This is part of an ongoing collaboration with Pavel and Timur, more results coming soon.
ON A JOURNEY

Just as a photograph converts the 3 dimensions of every day life into a 2 dimensional surface and interprets that 3D “reality” from a certain angle and perspective and through certain filters, loss landscape visualizations transform the multidimensional weight space of optimization processes into a much lower dimensional representation which we also process in different ways and study from a variety of angles and perspectives.
In both cases, even though we are simplifying the underlying “reality”, we are producing representations which provide useful information and may trigger new insights.
Through a combination of different tools and strategies, the loss landscape project samples hundreds of thousands of loss values across weight space and builds moving visualizations that capture some of the mysteries of the training processes of deep neural networks. In the intersection of technology, A.I and art, the LL project makes use of the cutting edge fast.ai library and the latest 3d proyection, animation and video production technology to produce pieces that take us on a journey into the unknown.


Crafting the mission
The LL project crafting strategies are based on cutting edge artificial intelligence research combined with creative intuition. The mission is to explore the morphology and dynamics of these elusive creatures and inspire the community with visual pieces that make use of real data produced by deep learning training processes.
Every LL piece is carefully crafted with a combination of the finest tools and resources, from fast.ai to cutting edge 3D and movie production software.
Phase 1 is now completed and Phase 2 is currently being prepared.


xyz

Going deep